


Editor’s note: This essay is part of a series by the author about the state of American politics.
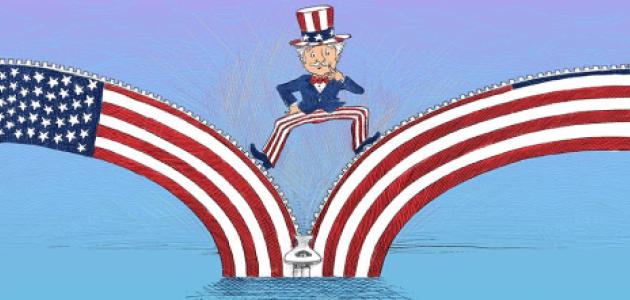
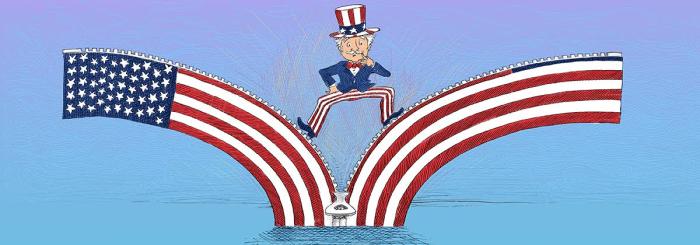
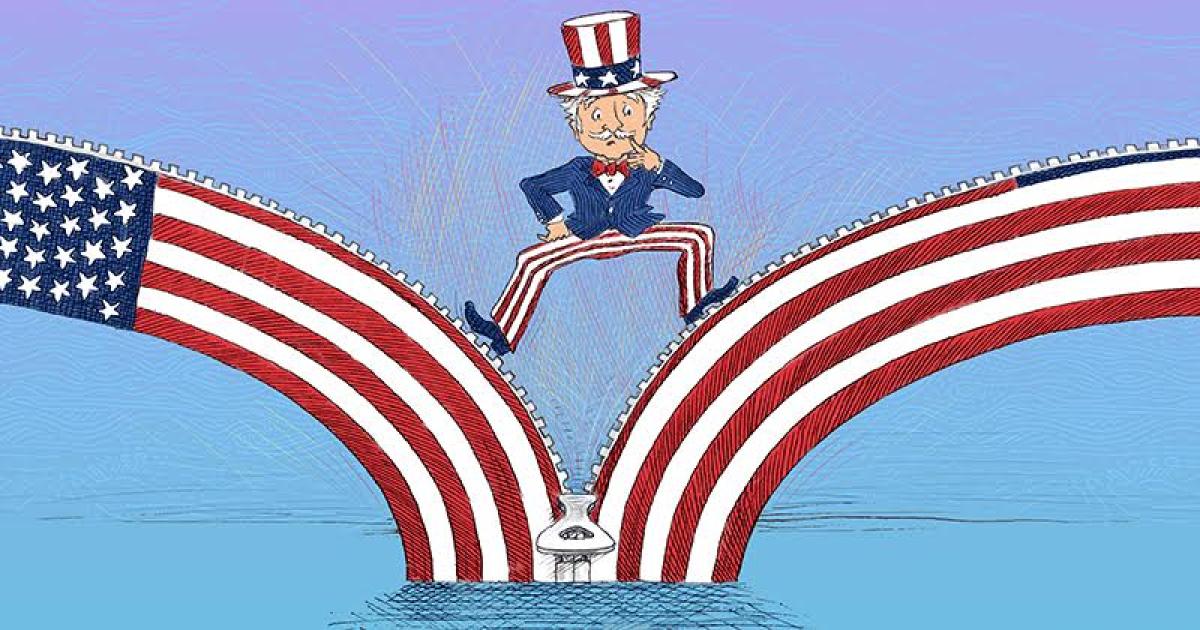
"The red states get redder, the blue states get bluer, and the political map of the United States takes on the coloration of the Civil War.” —E. J. Dionne Jr.
“In the wee small hours of November 3, 2004, a new country appeared on the map of the modern world: The DSA, the Divided States of America. . . . Not since the Civil War has the fault line between its two halves been so glaringly clear.” —Simon Schama
Claims like those quoted above became commonplace in the early years of the new century. Consequently, anyone who pays even casual attention to discussions of American politics in the media is likely to believe that American politics has polarized. Although assertions about polarization often are made in unconditional form, such claims can be true or false depending on what aspect of American politics we consider.
The U.S. Congress, for example, clearly supports the contention that American politics has polarized. Keith Poole and Howard Rosenthal have developed a statistical methodology for estimating the ideological positions of legislators from their roll call votes. For much of American history, especially in more recent decades, members of Congress could be placed on a single ideological dimension, generally considered to incorporate economic issues, particularly redistribution. If you compare the Congress elected in 1960 with that elected in 2008, the Congress faced by Barack Obama in his first year as president was far more polarized than the one faced a half century earlier by John Kennedy in his first year—more members were on the left and right of the ideological spectrum in 2009-10 than in 1961-62 and fewer were in the middle. Moreover, the partisan distributions have become more distinct. In sharp contrast to the Congresses elected a half-century ago, in most recent Congresses, the party distributions do not overlap: the most liberal Republican falls to the right of the most conservative Democrat. Poole and Rosenthal date the start of this polarizing trend to the early 1970s.
Many American state legislatures show the same polarizing trend. Utah, Washington, and California, for example, are now more polarized than the U.S. House. Other polarized state houses include Colorado, New Mexico, Wisconsin, Michigan, Arizona, Maryland, Texas, and Minnesota. Most state senates are even more polarized than the U.S. Senate. For reasons as yet unknown, a few state legislatures—like Louisiana, Rhode Island, Massachusetts, and West Virginia—seem to have bucked the polarizing trend.
Data on other important political actors are less extensive, but they show trends similar to those for members of Congress. Party and issue activists, for example, have moved further apart in the past several decades. Here party activists are those who self-identify as a Republican or Democrat and report that they worked for a candidate or party. Such individuals typically comprise 5 percent or so of the eligible electorate. In 1972 such activists were 1.53 units apart on the standard seven-point ideological scale included in the American National Election Studies (ANES). But that distance had doubled to 3.04 units by 2012. Fewer activists fall in the moderate middle today; more position themselves toward the extremes. The same is true for campaign contributors, another class of important political actors. Generally they comprise about 10 percent or so of a national sample. Donors, too, have become more polarized during the past several decades. In both cases, Republicans contribute more to the increase in polarization than Democrats do. The 2012 Cooperative Congressional Election Study surveyed 35,000 people, a large enough sample to include numerous donors. That survey found that relative to those who do not contribute, donors—whether big or small—tend to come from the ideological poles, a tendency that research indicates is increasing.
These examples capture our intuitive understanding of the concept of polarization: the middle loses to the extremes. There is a great deal of evidence that at the highest levels of political involvement—elected officials and candidates, donors, and party and issue activists—the claim of increased polarization is accurate. In what follows, I will call this rarified stratum of political actors the political class, as compared to the rest of the electorate, whom I will refer to as normal people.
The American people recognize these polarizing trends. The proportion believing that there are important differences between the two parties has risen 30 percentage points in the past half century. In 1968 almost half the electorate agreed with American Independent Party candidate George Wallace when he scoffed that there was not a “dime’s worth of difference” between the Republicans and Democrats, but a much smaller proportion agrees with such an assertion today. As the parties became more distinct, more and more Americans naturally came to believe that the outcome made a difference to them: more people care about the outcome of elections today than did before the election of Bill Clinton. According to the ANES, from Dwight Eisenhower in 1952 through George H. W. Bush in 1988, the proportion of people reporting that they “cared a good deal” about the outcome of the presidential election ranged between 56 percent and 65 percent. Since 1992 it has never fallen below 75 percent and has ranged between 75 and 85 percent.
Given these, many readers will be surprised to learn that we do not see analogous trends when we look at distributions of normal people—typical Americans who are not deeply involved in politics. On the contrary, when Americans are asked to classify themselves ideologically, we do not find them moving away from the middle and lumping up at the liberal and conservative poles. Instead, the way that Americans self-categorize their ideological positions has changed little in four decades. The General Social Survey (GSS) series is flat, showing nothing beyond sampling variability. The CBS News/New York Times series fluctuates more, but the proportion of moderates in the two Obama elections is about the same as in the two Carter elections. The ANES series shows a drop of about 8 percentage points, but "moderate" remains the modal category in the series. Moreover, as political scientist Philip Converse pointed out, even this decline may be more apparent than real—the drop in moderates in the ANES series is due mostly to a drop in “don’t know” responses, which are typically classified as moderate.
To continue reading this essay, please click here.
