












- Economics
With the US economy growing at a healthy clip and unemployment low, many people ask: Are workers paid appropriately? The rise in stock market valuations, high home prices, and the soaring wealth of artificial-intelligence innovators that accentuate wealth inequality make the question about wages even more urgent. On a topic so central to fairness and living standards, it’s important to use data that carefully measure and evaluate compensation.
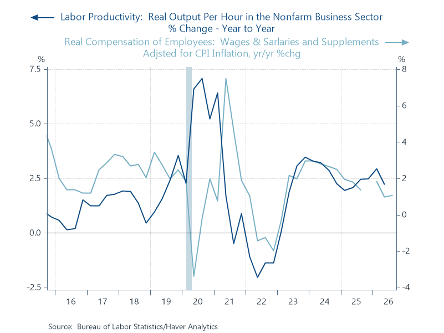
The proper benchmark for assessing wage compensation is whether it keeps pace with inflation and reflects worker productivity. In the years before COVID, when adjusted for inflation, wage compensation—total wages and salaries plus supplements such as employer contributions to pensions and savings plans—closely tracked productivity gains (Chart 1).
The 2020s have been a different story. Wages have increased significantly—and data show the wage gains of lower-income workers have outpaced the gains of higher-income workers—but persistently high inflation has undercut those gains. Consequently, while real wages have increased, they haven’t kept pace with worker productivity.
Persistent inflation is the culprit. No wonder surveys show Americans losing confidence in the economy.
Chart 1. Real compensation and labor productivity
Another measure that gets a lot of attention but is highly misleading is the labor-compensation share of gross domestic product. By this measure, wage compensation has fallen substantially as a share of GDP. Critics compare this falling labor-compensation share with the ratios of profits and returns to capital to GDP, which are rising, and incorrectly reach the conclusion that profits and returns to capital are impinging on workers’ wages. Too many economists who base their observations on these ratios do not carefully think about what their numerators and denominators measure and what they don’t—and inadvertently are mixing apples and oranges.
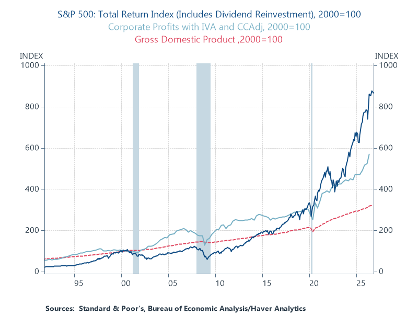
In an advancing economy with healthy growth and innovations, it’s natural and unsurprising that the labor-compensation share of GDP falls while profits and returns to capital rise. In fact, that’s what’s been happening. Chart 2 shows wage compensation as a percent of GDP, often referred to as the “labor share.” Chart 3 shows corporate operating profits, the S&P500 (including dividend reinvestment), and nominal GDP, all indexed to 2000=100. Profits and returns to capital are rising sharply as a share of GDP.
Chart 2. Labor share: wage compensation as a percentage of GDP
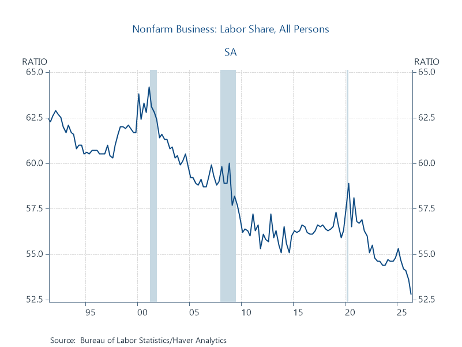
Chart 3. Profits and S&P500 total returns, 2000=100
Thinking through the data, particularly what GDP measures and what it doesn’t, helps to explain how rising profits and returns to capital are largely complements to worker compensation and enhance economic well-being. Yet this measure of wage compensation to GDP is widely used to suggest that companies and capitalists are getting ahead at the expense of workers.
Before describing the data, at the outset, my preference is for wage compensation to rise and inflation to recede to the Fed’s 2 percent target so real wage compensation catches up to productivity gains. The persistent inflation since 2021 makes it an uphill struggle. Many businesses may find that raising worker compensation reduces job turnover and lowers business operating costs and improves business efficiency. But in any case, misusing data muddles the issue.
GDP measures what is produced in the United States by both domestic and foreign companies, and is not the proper benchmark for evaluating wage compensation. In its most familiar expenditure form, GDP includes consumption and business and residential investment spending (largely spending on new construction and improvements), adjusted for changes in inventories, government purchases (largely spending that absorbs national resources but not does not include transfer payments like Social Security), plus exports minus imports. (US national income, a closely related counterpart to GDP, measures the total income earned by residents, but diverges from GDP in the short-run, reflecting changes in net income from abroad, capital depreciation, and statistical discrepancies. Like GDP, it is not a good basis for evaluating the fairness of worker wage compensation).
You can see how the labor share in Chart 1 can be misinterpreted. The ratio of wages to GDP falls when businesses increase investment spending—say, for new computers or a new production facility--which adds arithmetically to GDP. Yet the investment and the technological innovations embodied in it is clearly a positive for the economy and enhances workers’ productive capacity, which should lift real wages. There’s a much larger flaw when the falling wage share of GDP is compared with the rising ratios of profits and returns to capital to GDP. In this regard, it’s important to keep in mind what GDP doesn’t include.
While US workers are compensated for their contributions to domestic production, US businesses’ activities overseas, involving overseas employees (either US citizens or foreign) and production, are largely uncounted in US GDP, but they generate profits that are repatriated into US companies’ balance sheets and boost their returns on capital.
Among S&P 500 companies, an estimated one-third of employees work overseas, and one-third of revenues and an even higher share of profits are generated overseas. Smaller firms have substantially less international activity, but the overseas activities of large multinational US firms significantly affect the aggregate data. Goods produced overseas by subsidiaries of US businesses are counted in GNP (gross national product) but not GDP. Goods produced overseas by non-US firms that are a critical part of supply chains of US companies also largely fall outside of US GDP. Nevertheless, they too may add significantly to the well-being of US consumers and provide net benefits to US workers.
With so much US company production overseas, it’s no wonder profits and returns to capital are rising compared to GDP.
Apple Inc. is a good modern example of a US-based company that relies heavily on overseas production and global supply chains. Nearly all of Apple’s iPhones, laptops, and other hardware are made and assembled overseas by companies that aren’t subsidiaries of Apple. Those Apple products sold internationally (60 percent to 65 percent) don’t show up in US GDP. The 35 to 40 percent of Apple goods manufactured overseas that are purchased in the United States have little impact on GDP, as imports largely offset domestic consumption. But they have boosted Apple’s profits, and have helped lift its capitalization to around $5 trillion.
The economic benefits to US consumers and Apple’s 80,000 domestic employees and many other US workers are obvious. Such benefits are not reflected by comparing the labor share of GDP to the ratios of profits and returns to capital divided by GDP.
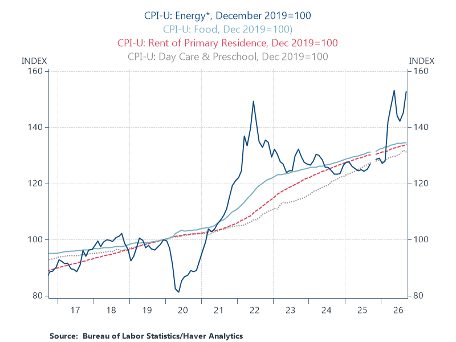
US workers’ far larger concern is the persistent inflation that has raised the Consumer Price Index more than 30 percent since just before the COVID pandemic in December 2019. For many working households, prices of necessities have risen even faster (Chart 4). Food prices are up more than 34 percent, and the cost of child care and preschool more than 31 percent. Gasoline prices are up 54 percent, and automobile insurance and maintenance combined are up about 50 percent. For the 34 percent of households that don’t own their dwellings, rental costs are up 34 percent. Taxes, too, cut into take-home pay.
In exit polls and surveys immediately after the midterm elections, nine of ten respondents said the high cost of living factored into their voting decisions.
Chart 4. CPI and select components, indexed Dec. 2019=100
Clearly, tariffs and the high energy prices stemming from the war with Iran have raised prices for US households, but the Fed’s excessive monetary accommodation has been a key factor that has driven persistent high inflation. It has also increased the value of long-lived asset prices, benefiting homeowners and stockholders. The Federal Reserve’s sustained zero rates and extensive purchases of mortgage-backed securities in 2020–21 helped boost housing values more than 50 percent, benefiting homeowners, but that raised costs for renters and put home prices out of reach for many potential buyers. After raising interest rates in 2022-2023, the Fed has tolerated high core inflation excluding food and energy.
Fed Chair Kevin Warsh now correctly argues that inflation above the Fed’s target of 2 percent is not tolerable, and under his direction, the Fed has begun taking away the monetary accommodation to lower inflation. But note that even if the Warsh-led Fed is successful in reducing inflation to 2 percent, it still means prices will be rising, but at a slower pace. Once the Fed achieves its target, it should seriously reconsider its notion that 2 percent inflation amounts to price stability.