


- Economics
What's Behind the Numbers? allows authors to provide additional insight and an explanation into how they arrive at their conclusions. It consists of the data files, calculations, and other materials that inform the analysis but do not traditionally fit into an op-ed.
This is the statistical backup for the statements Edward P. Lazear made in his April 28, 2016, Wall Street Journal op-ed “America's Coming Tax Increase.” Data are from the OECD.
From the OECD, the variable definitions are as follows:
Tax Burden: Tax Revenue (as % of GDP):
Tax revenue is defined as the revenues collected from taxes on income and profits, social security contributions, taxes levied on goods and services, payroll taxes, taxes on the ownership and transfer of property, and other taxes. Total tax revenue as a percentage of GDP indicates the share of a country's output that is collected by the government through taxes. It can be regarded as one measure of the degree to which the government controls the economy's resources. The tax burden is measured by taking the total tax revenues received as a percentage of GDP. This indicator relates to government as a whole (all government levels) and is measured in USD, USD per capita, percentage of GDP and annual growth rate.
VAT Rates:
The Consumption Tax Trends 2014 publication illustrates the evolution of consumption taxes as instruments for raising tax revenue. It identifies and documents the large number of differences that exist in respect of the consumption tax base, rates and implementation rules while highlighting the features underlying their development. It looks, in particular, at developments in the Value Added Tax/Goods and Services Tax (VAT/GST) area. It notably presents an updated estimate of the VAT Revenue Ratio (VRR) for OECD countries, providing an indicator of the loss of VAT revenue as a consequence of exemptions and reduced rates, fraud, evasion and tax planning. It also notes the emergence of the OECD International VAT/GST Guidelines as the international standard for the application of VAT to cross-border trade in services and intangibles.
Government Spending (as % of GDP)
General government spending, as a share of GDP and per person, provides an indication of the size of the government across countries. General government spending generally consists of central, state and local governments, and social security funds. The large variation in this indicator highlights the variety of countries' approaches to delivering public goods and services and providing social protection, not necessarily differences in resources spent. This indicator is measured in terms of thousand USD per capita and as a percentage of GDP. Data are under System of National Accounts 2008 (SNA 2008) for all countries except for Chile, Japan and Turkey where data are under SNA 1993.
Table 1: Summary Statistics
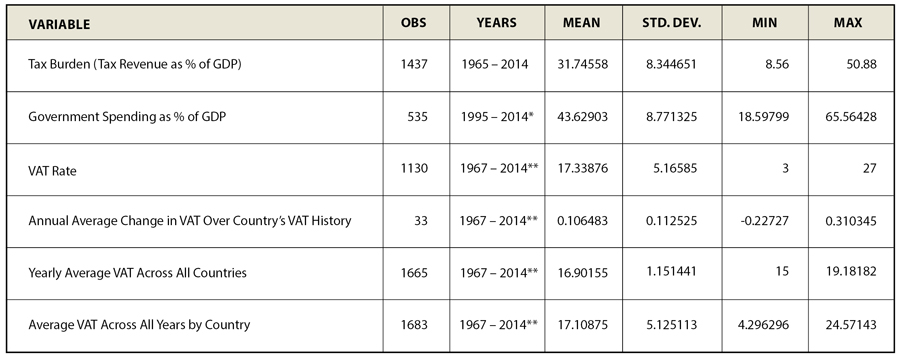
Table 1: Summary Statistics. Source: OECD Consumption Tax Trends, 2016, OECD Tax Revenue (2016), and OECD Government Data (2016)
* For Korea and the United States, observations begin in 1970, for Finland, observations begin in 1990.
** In 1967, only Denmark had a VAT. By 1973, 11 OECD countries had VATs, by 1986, 20 countries had VATs, and by 2000, all 33 countries that currently have VATs had implemented the tax.
Under current law, the Congressional Budget Office projected earlier this year that the deficit will grow to over 4% of GDP in six years and to 5% of GDP in 10 years. Deficits of this magnitude will rapidly increase federal debt. In an earlier CBO report’s “alternative” scenario, which makes realistic assumptions about the political process, the U.S. public debt will almost double again from its already high level in just over two decades.
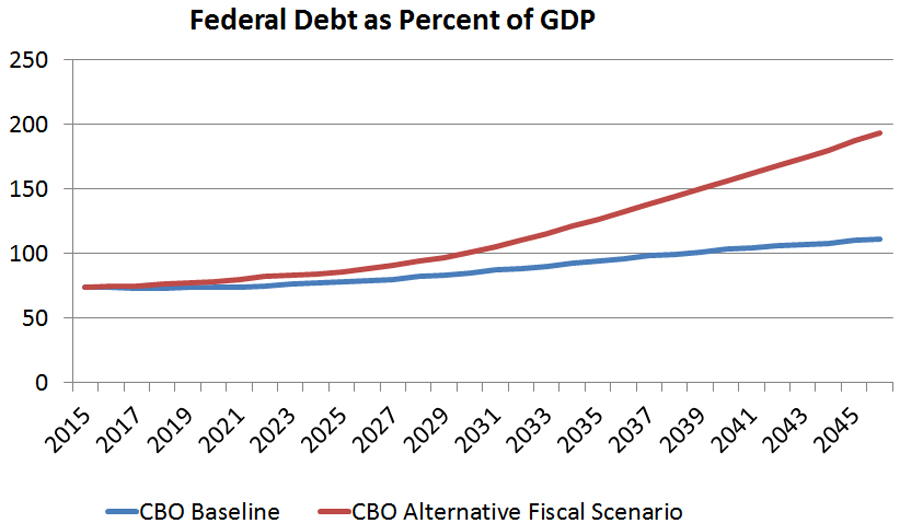
Figure 1: CBO Federal Debt Held by Public as % of GDP Projections. Source: Congressional Budget Long Term Budget Projections, June 2015
The OECD data support that logical proposition. In 2012 (the last year for which data are almost complete), the seven countries with the highest spending ratios, defined as the ratio of central, state and local spending to GDP, were also the seven countries with the highest tax burden.
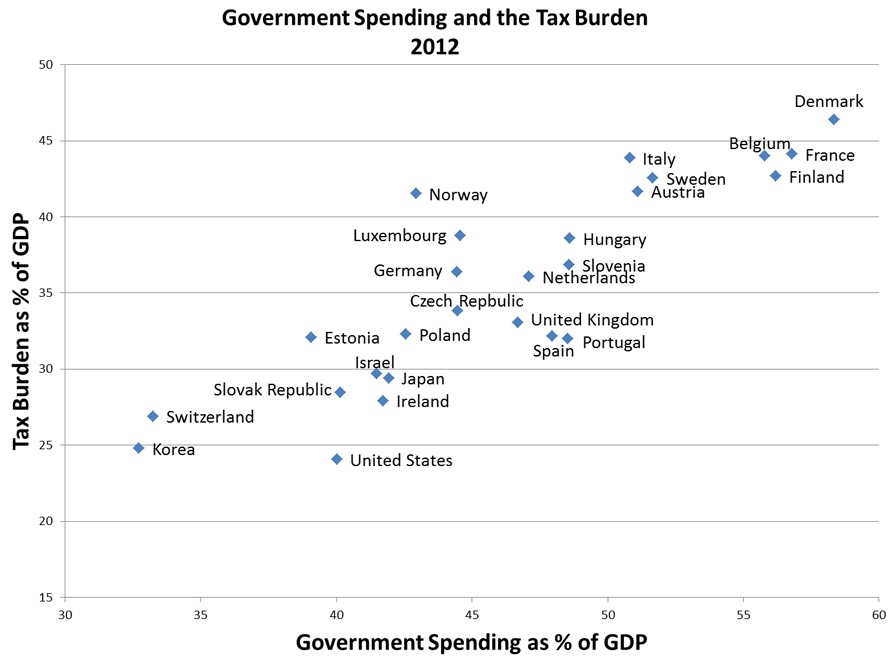
Figure 2: Government spending as % of GDP against tax burden as % of GDP in year 2012. Source: OECD, 2016
The point holds for a given country over time as well. There is a strong within-country statistical relation between spending and tax burden. As countries raise their spending ratio, they also raise the tax burden.
Table 2: Country Fixed Effect Regression of Tax Burden on Spending
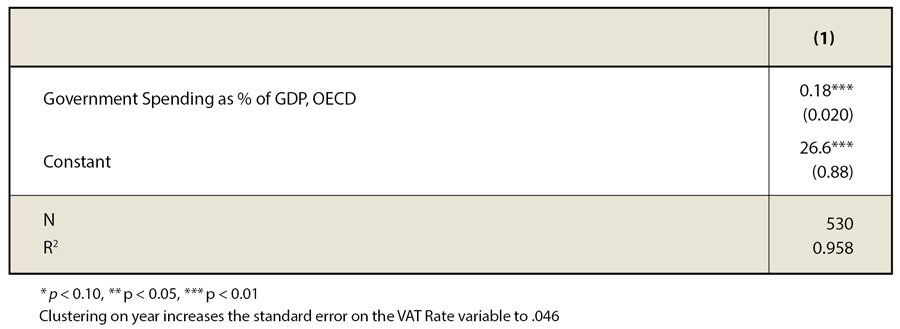
Table 2: Source: OECD, 2016
All 34 OECD countries, except the United States, have a VAT. Twenty-six out of thirty-three have higher VATs now than they did when they first instituted a VAT. The only countries that have a lower VAT rate now are Canada, Chile, the Czech Republic, and the Slovak Republic.
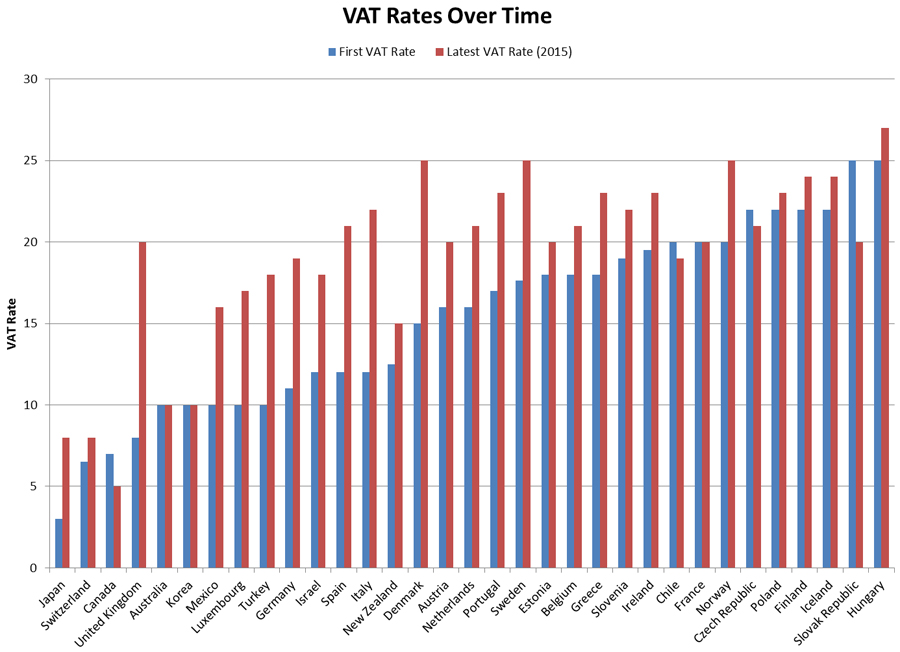
Figure 3: VAT rates when the country first started the VAT, and VAT rates today. Source: OECD Consumption Tax Trends, 2016
The average VAT today among these countries is 19%, four percentage points higher than they were when they started.
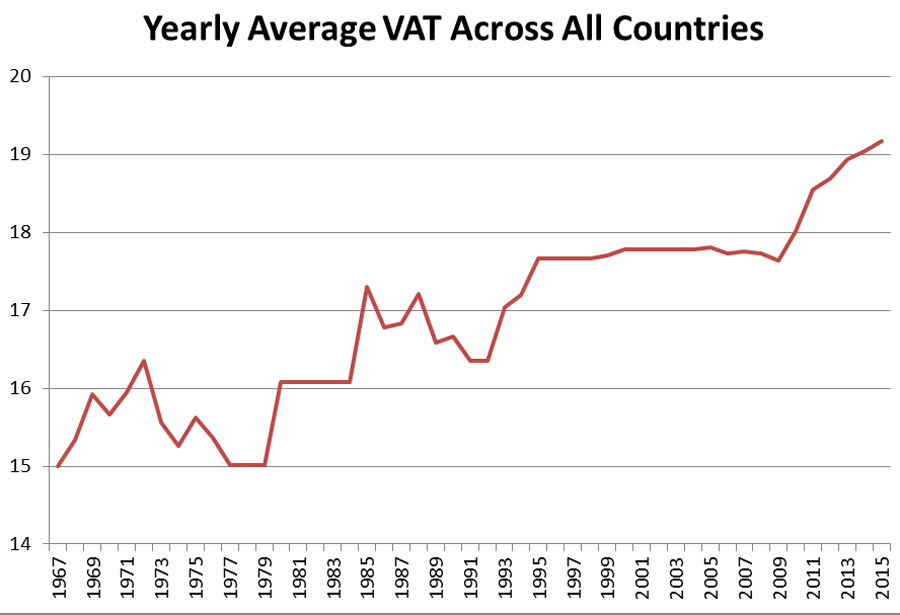
Figure 4: Yearly Average VAT rate across all countries. Source: OECD Consumption Tax Trends, 2016
Of the 14 countries with VATs that are above the median for the group, all but three (Ireland, Spain, and Poland) have tax burdens that exceed the country average.
Table 3: Tax Burden and VAT Rates, 2013
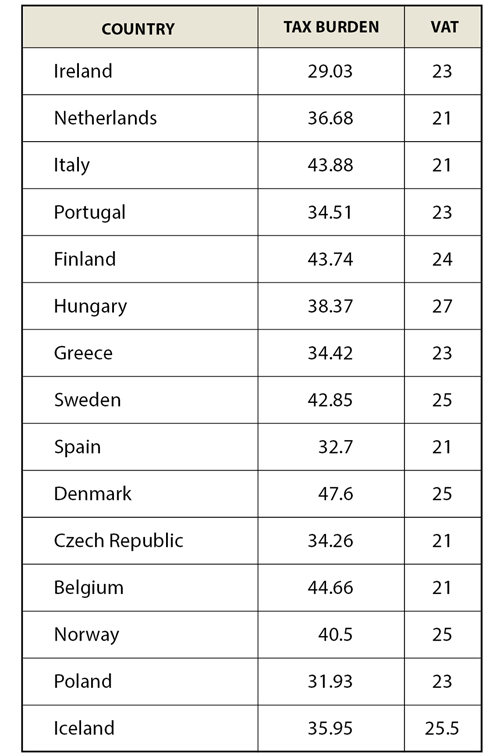
Table 3: Tax burden and VAT rates for countries with greater than median VAT rates in year 2013. Source: OECD Consumption Tax Trends, 2016 and OECD Tax Revenue (2016)
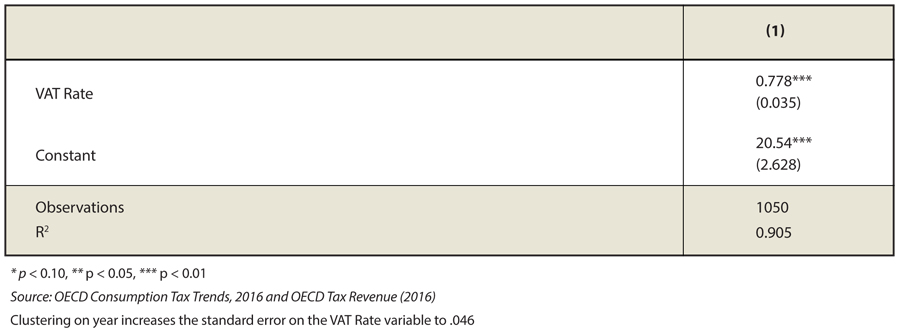
It is also true that tax burden grows as a given country increases its VAT over time. Specifically, for every one percentage point that the VAT increases, the tax burden rises by .8 of a percentage point. Were it a pure substitute tax, raising the VAT would have no effect on total taxes collected.
Table 4: Regression of Tax Burden on VAT Rates