


Headlines have announced that many wealthy individuals and businesses are fleeing California. Those with the highest profile have been Elon Musk with Tesla and Larry Ellison with Oracle. According to recent data, 2020 was the first year since 1900, when such information began to be collected, in which California’s population declined. Even so, the idea that the wealthy are leaving California has primarily relied on anecdotes rather than systematic evidence, and the actual costs to the state and its tax base of these departures has been unknown.
In a new paper, we use data directly from California state tax filings to study how migration has varied across tax brackets over the past two decades. Reports of overall population decline are cause for concern, but for the economy, it matters whether the outflow is in fact driven by higher-income or lower-income taxpayers. While an overall population loss is problematic, one where high-income citizens are leaving at a particularly high rate translates more quickly into reduced public resources and contracting economic activity, given the relatively large share of income earned by, and taxes paid by, high earners. Declines in population driven by high earners mean reduced tax revenues for Sacramento, and reduced job opportunities for middle- and lower-income Californians who are less mobile.
So, what is responsible for this decline? While California’s high tax burden has been a prime suspect, there are other potential culprits: some of the highest housing costs in the nation, an inhospitable regulatory environment for businesses, comparatively poor-quality public services, and so on.
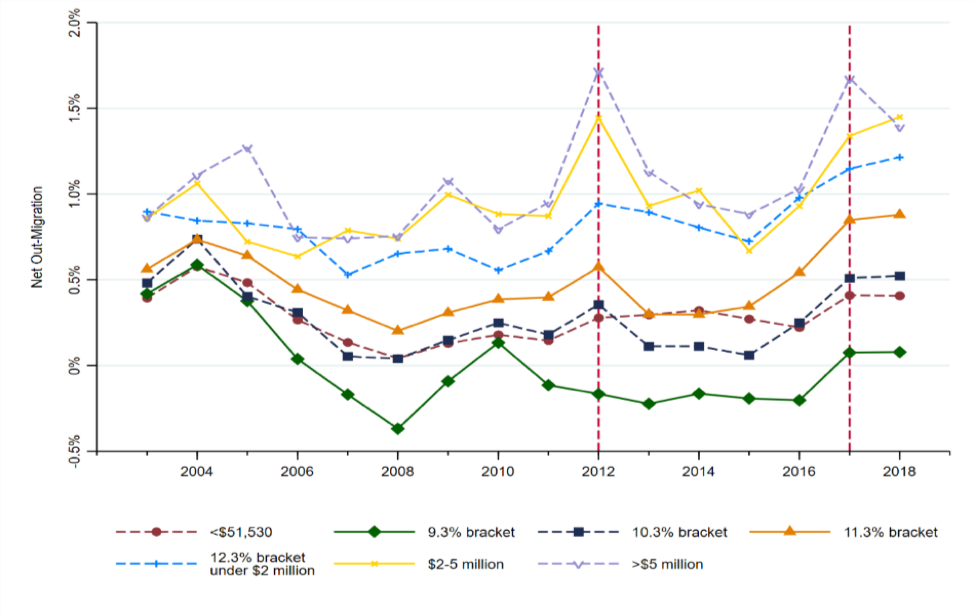
By studying the departure rates of taxpayers around major tax events, specifically California’s Proposition 30 (passed in 2012) and the federal Tax Cut and Jobs Act (TCJA, signed in 2017), we document the role that taxes play for high-income filers when making location decisions. Out-migration spiked for the highest earners, particularly those making over $5 million a year, around both tax policy changes. Even worse, in-migration did not keep pace, resulting in net out-migration rates of about 1.75 percent in 2012 and 1.7 percent in 2017 for high earners making more than $5 million per year (see Figure 1). Furthermore, net departure rates for top bracket filers remained elevated in the pre-pandemic years.
Figure 1: Net Out-Migration Rate by Tax Bracket
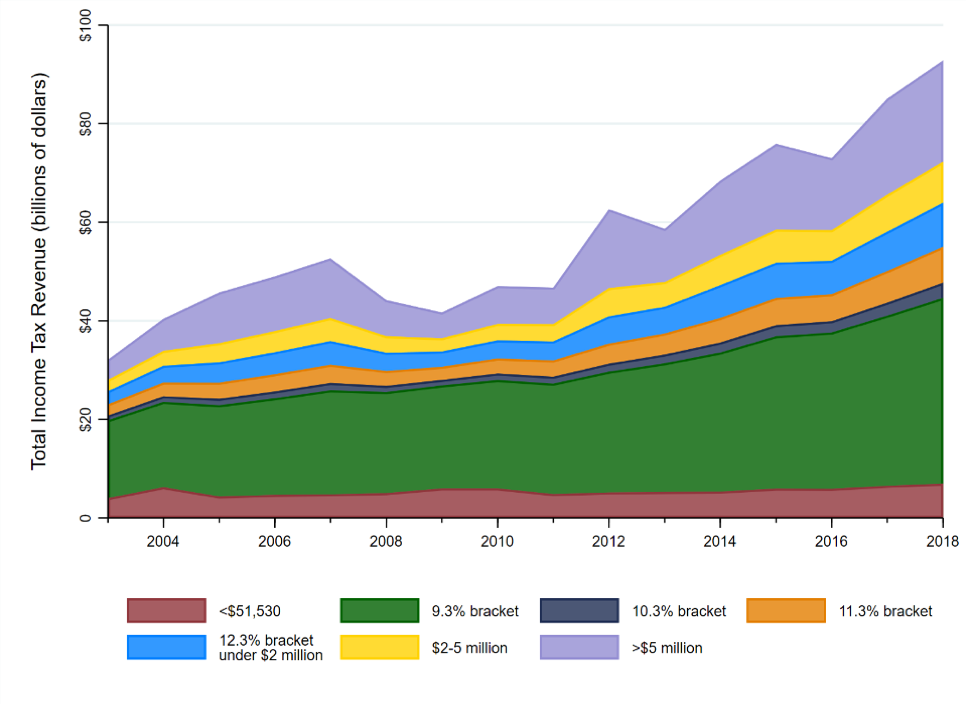
We find in this research that these migration trends may have significant implications for the state and its residents. From 2003 to 2018, income tax revenue as a share of Sacramento’s total revenue grew by approximately 20 percentage points, totaling $93.8 billion (in 2015 dollars) by the end of the time period.
At the same time, the state’s reliance on the top income tax bracket for these revenues also increased considerably. We show in the paper that by 2018, those earning over $5 million a year—just 0.1 percent of the income-tax-paying population—paid more than a fifth of California’s income tax in that year (see Figure 2). Bearing in mind this group’s high level of mobility and propensity to respond to tax policy changes, the state’s dependence on top earners for revenue is risky at best.
Figure 2: Total Income Tax Revenues by Tax Bracket
But while Sacramento may be most concerned with the amount of revenue filling its coffers, the losses to overall economic prosperity associated with out-migration are perhaps best reflected in the taxable income that may be lost when people leave the state. A person living in the state likely spends a large share of their income within the state, thereby producing other revenues for the state through property, sales, and gas taxes. Their spending also supports California businesses, employment, and general economic opportunity within the state. When an individual moves to a new state, California loses out on more than just income tax revenues; it also misses out on that future income and the spending that comes with it.
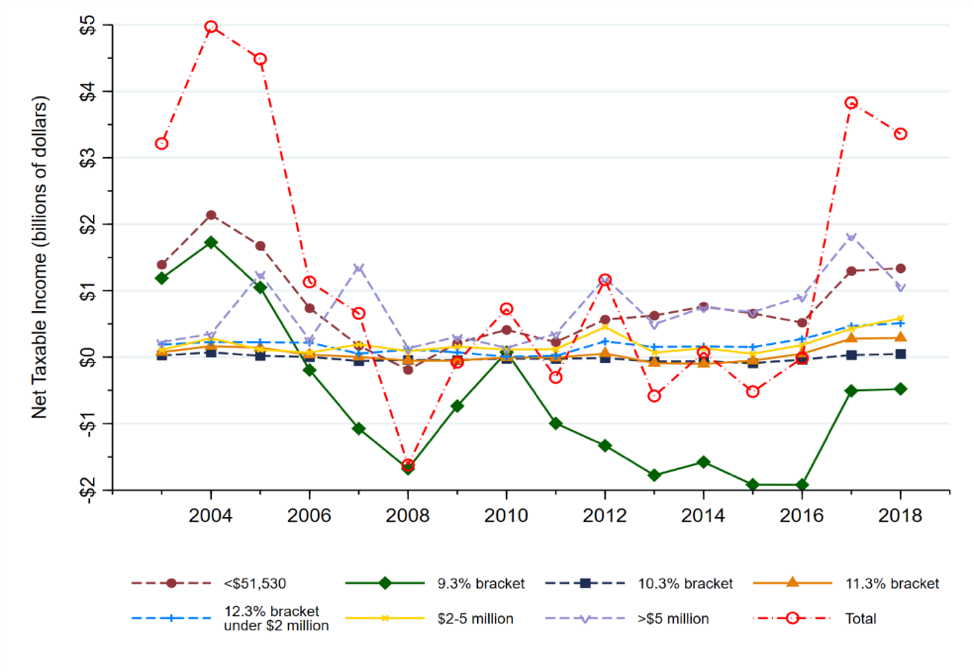
We find that the taxable income that is potentially moving out with emigrants is not consistently replaced by that coming into California with in-movers. In the early 2000s, this trend was likely due to continued effects from the dot-com bust or the state’s energy crisis. Later in the time period, however, we see spikes in out-moving taxable income associated with Proposition 30 and the TCJA, particularly for the highest earners. In 2017, net taxable income (out-movers minus in-movers) reached $3.8 billion, nearly half of which can be attributed to out-movers earning more than $5 million a year (see Figure 3).
Figure 3: Taxable Income of Out-Movers in Final Year minus Taxable Income of In-Movers in Initial Year by Tax Bracket
Yet this focus on the level of income departing or arriving in California misses part of the picture of total economic activity.
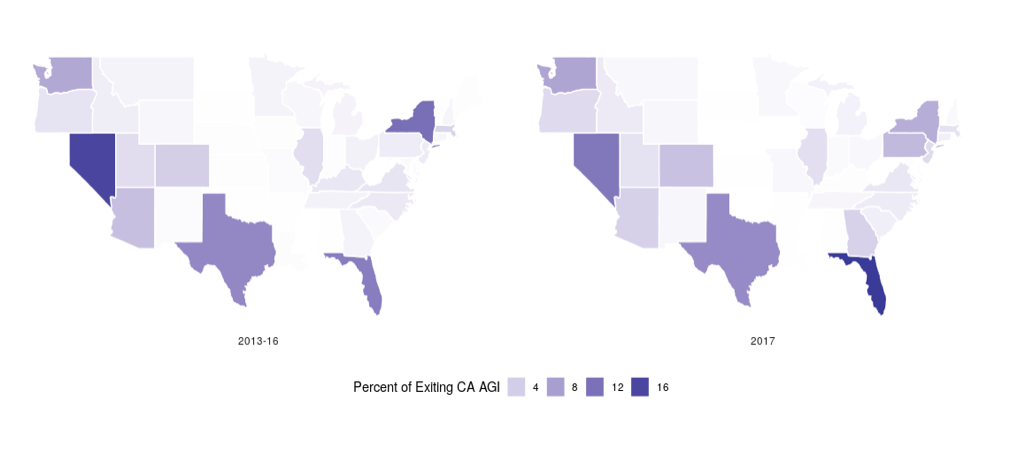
But one state’s loss is another state’s gain. Our research shows that a few states in particular have become increasingly popular destinations for movers from California. Zero-income-tax states like Florida, Nevada, Texas, and Washington have seen larger numbers of high-earning movers from California, while high-tax states like New York have become less popular for departing Californians over time, particularly after the TCJA was passed (see Figure 4). This lends further support to the idea that the location decisions of the wealthiest individuals are tax-motivated. While many of the most popular destination states levy no income tax, they benefit nonetheless from the economic activity and other tax revenues generated by these high-income arrivals from California.
Figure 4: Mover Destinations Before and Around TCJA
Sacramento’s increasing reliance on a small group of highly responsive, highly mobile top earners for revenues undoubtedly places the state in a precarious financial position. Though our research provides a clearer picture of California’s population decline and its deleterious economic implications over the past two decades, we suspect that the COVID-19 pandemic has only exacerbated these trends as the positive network externalities to living in the Golden State have further unraveled.
In early 2022, state policy makers proposed a new top marginal income tax rate of 18.05 percent and further increases to tax rates on businesses. Further tax increases are likely to drive even more taxpayers out of California and further affect the state’s economic dynamism, in effect killing the goose that lays the golden egg.
