


- Politics, Institutions, and Public Opinion
- Campaigns & Elections
The 2008 elections gave the Democrats the House, the presidency, and a “filibuster proof” Senate. Pundits spoke of the election as a “game changer.” Evan Thomas wrote that “Like Franklin Roosevelt in 1932 and Reagan in 1980, the Obama run of 2008 marks a real shift in real time. It is early yet, but it is not difficult to imagine that we will, for years to come, think of American politics in terms of Before Obama and After Obama.”1 According to Borsage and Greenberg: “But election 2008 was not simply a testament to the remarkable candidacy of Barack Obama, nor a product of Bush’s catastrophic presidency. Rather, the results suggest that this may not be simply a change election but a sea-change election . . . we may be witness to the emergence of a new progressive majority, that contrary to conservatives’ claims, America is now a center-left nation.”2 Even James Carville’s 40 More Years: How the Democrats Will Rule the Next Generation did not seem as outlandish when published in early 2009 as it does in the aftermath of the 2010 congressional elections.
This article examines what happened to the president and his party between the electoral zenith of November 2008 and the nadir of November 2010. We begin by reviewing an analysis that appeared in these pages early in 2009. Contrary to much commentary at the time, that analysis showed that the Obama victory was less a reflection of an electorate that had moved to the left than it was a negative judgment on the performance of the Bush administration. We extend that analysis, showing that in 2009 and 2010 the public came to view the performance of the new administration increasingly negatively, in part because of policies it pursued that did not enjoy wide popular support. In particular, we show that the administration’s focus on health care and, to a lesser extent, cap and trade probably cost the Democrats their House majority. We conclude with brief speculations about the prospects that the new Republican House can make progress on its avowed goal of reducing government expenditures.
The road to 2008
As we pointed out in our earlier article, between 2004 and 2006, numerous public opinion polls reported a significant increase in Democratic Party identifiers and a corresponding decrease in Republican identifiers.3 Since these polls were cross-sectional snapshots, however, the causes of the change were unclear. Thus, we commissioned YouGov/Polimetrix, an internet-based poll, to sample nearly 13,000 respondents who had been in their large database since 2004. This allowed us to track change in party identification over the four-year period and relate them to questions about the policies and performance of the Bush administration.
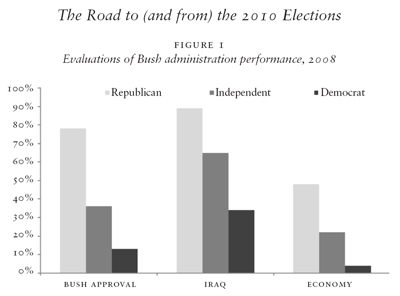
Figure 1 shows that 2004 Republicans who stuck with their identification in 2008 were much more likely to approve of the Bush administration’s overall performance as well as its handling of the war in Iraq and the economy than were stable independents and 2004 Republicans who had moved to Independent in 2008. The latter in turn were more favorable to the administration than stable Democrats and 2004 Republicans and Independents who had moved to the Democratic side in 2008.
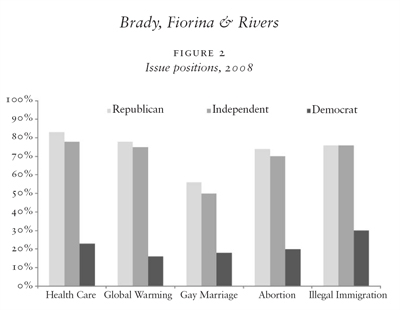
But while disapproval of the Bush administration was strongly associated with movement away from the Republican Party, disapproval did not indicate that voter sentiment was shifting to the left across a range of policy issues. We used the same survey to examine public positions on a set of issues where party differences were clearly evident: universal healthcare, global warming, gay marriage, abortion rights, and illegal immigration. The Republican response was coded as: oppose universal health care, think effects of global warming are overstated, oppose any legal recognition of same sex couples, allow no abortions or only in case of rape and incest, and favor deportation of illegal immigrants. Figure 2 plots the percent taking the Republican response for each of the three categories of respondents: stable Republicans, stable and new independents, stable and new Democrats. Large majorities of those who remained Republican between 2004 and 2008 favor the Republican position on these issues, but the opinions of those in the independent category are much closer to the opinions of stable Republicans than to the Democratic side. Thus, the battering the Republicans experienced in 2006–2008 was much more a result of dissatisfaction with the performance of the Bush administration than an indication of a policy realignment in the electorate.
From 2008 to 2010
Contrary to our 2009 conclusion, many commentators assumed that the 2008 elections had ushered in a new progressive era. President Obama came to Washington with an ambitious policy agenda featuring a stimulus package, health care reform, energy and environmental legislation, financial reform, and foreign policy change, among other lesser goals. At first things went smoothly. The stimulus package passed handily with the promise that it would keep unemployment at 8.2 percent or less. But the health care and environmental proposals faced tougher sledding than the stimulus. The Democratic majority in the House was more liberal than the Democratic majority in the Senate. In particular, it was clear from the beginning that the single payer and public option plans favored by the most liberal wing of the Democratic Party had no chance of passing the Senate. After months of contentious politics, even a much weaker version of health care reform appeared doomed as late as February 2010. But through a series of parliamentary procedures and House compromises, the Democrats finally enacted the Patient Protection and Affordable Care Act in March of 2010.
The story on cap and trade was simpler. The House passed it but Senate Democrats representing coal producing states and states dependent upon coal for energy joined with Republicans to prevent consideration. After a lengthy process the two chambers agreed on a financial reform bill in July of 2010. All in all, despite the failure of cap and trade and the compromises entailed in passing health care and financial reform, the Democrats had enacted a stimulus package, a major health care bill, financial reform, and other less significant legislation. From the standpoint of legislative production, the 111th Congress excelled. For Joe Klein in Time, “the legislative achievements have been stupendous,” and in the judgment of Doris Kearns Goodwin, “I don’t think we’ve ever seen anything like Obama since Roosevelt.”4
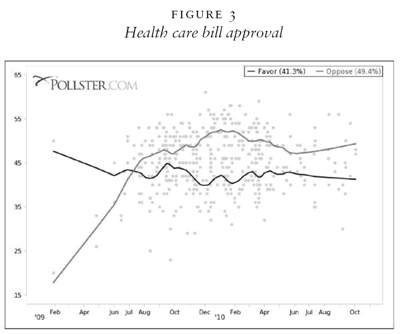
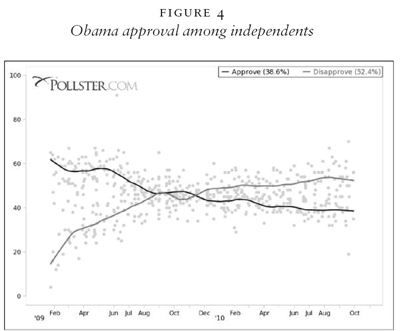
From an electoral standpoint, however, this legislative productivity was a different story. As Figure 3 shows, from the summer of 2009 to the election, more Americans opposed the health care reform than favored it, although parts of it were popular. The burst of legislative activity on multiple fronts made middle-of-the-road voters receptive to Republican charges that federal power and spending were out of control. Moreover, by summer 2010, the claim that the stimulus would keep unemployment below 8.2 percent had clearly proved wrong. The combination of a very slow and weak economic recovery, concern about the deficit, and negative opinion toward the president’s policies combined to bring the president’s approval ratings down. The most significant drop in approval and increase in disapproval occurred during the health care debate from late May 2009 through December. From more than 70 percent approval at the time of his inauguration, the president’s approval ratings fell below his disapproval ratings by the summer of 2010. Perhaps most significantly, approval among independents fell most quickly; a plurality of them already disapproved by late summer of 2009 (Figure 4).
According to our YouGov/Polimetrix surveys, many Americans were skeptical about their prospects under the new health care regime. By mid-2009 about 40 percent said they would receive worse care if the bill passed compared to slightly less than 20 percent who thought they would be better off than before the bill. After passage the gap between worse and better care widened slightly, with 40 percent holding worse off and about 15 percent better off. And on the cost side, Americans were skeptical about claims that they would get improved care with less cost: Over 50 percent of those polled believed that their costs for health care would increase compared to 10 percent or so who thought their costs would decrease.
Independents had moved very sharply to the Democrats in the 2006 congressional elections — by a margin of 18 percentage points according to the national exit polls. Thus, their growing disenchantment with the president threatened Democratic prospects in 2010. In addition, the number of self-professed independents had increased from about 31 percent in October of 2008 to over 36 percent in October 2010. The increase in Independents came at the expense of Democrats who declined from about 36 percent to about 32 percent. During the same period Republicans stayed at the same level — about a quarter of the electorate.
The 2010 Democratic shellacking
The preceding developments superimposed on a long, deep drop in employment and a very slow recovery generated stiff headwinds for Democrats in the 2010 elections. Democratic members from moderate and conservative districts were left particularly vulnerable. That condition proved fatal for many of them as Republicans targeted districts where Obama had lost to McCain, as well as districts that had been lost to Democrats in the previous two elections. In the election, eleven of 21 members of the class of 2006 lost their seats while 21 of 24 members of the class of 2008 lost. In total Republicans gained 63 seats in the House, the largest gain in a midterm election since 1938. Republicans also gained six Senate seats, seven governorships, control of nineteen state legislative chambers, and almost 700 new state legislative seats.
Exit polls revealed huge shifts to Republicans between the 2006 and 2010 midterms. Republicans turned an 18 point 2006 deficit among independents into a 17 point lead in 2010. Rural voters, older voters, and Catholics all showed four-year swings over 20 percentage points. Republicans gained nearly as much among white voters and high school graduates. They gained 13 percentage points over 2006 among those making less than$50,000 and those above $250,000 in income. They gained heavily in the Northeast and the Midwest. In 2010, pluralities thought Republicans better able than Democrats to handle the economy (+23%), spending (+27%), and taxes (+31%). In sum, voters, almost across the board, turned away from the Democrats.
As usual, post-election analyses by pundits and party spokespersons differed according to their political orientation. For the most part Republicans viewed the election as repudiation of Obama and his policies, while Democrats claimed they had not properly communicated their policy achievements or that Republicans had benefitted from illicit corporate contributions. Thus, the day after the election Rush Limbaugh exulted that Nancy Pelosi, whom he referred to as “the wicked witch of the West,” had a House fall on her.5 In contrast, in her day-after column Maureen Dowd wrote, “Republicans out communicated a silver-tongued president who was supposed to be Ronald Reagan’s heir in the communications department. They were able to persuade a lot of Americans that the couple in the White House was not American enough, not quite ‘normal,’ too Communist, too radical, too Great Society.”6
In spite of the predictability of the responses to the election, the question of what factors caused the Democratic debacle is an important one to answer. In the remainder of this article we turn to an analysis of the election results in an attempt to discern how much of the Democratic loss is attributable to the economy and how much attributable to the choices made by Obama and the Democratic congressional leadership.
The president’s party typically loses seats in midterm elections; the average loss for first term Democratic presidents in the postwar era is 30 seats. A very poor economy and a president below 50 percent in approval by themselves would generate significant losses for the incumbent party. But political science forecasting models based on the “fundamentals” badly under-predicted the Democratic seat loss — several even forecast that the Democrats would easily retain their House majority.7 Our hypothesis is that by pursuing a policy agenda to the left of the electorate’s comfort zone the president and the House leadership exacerbated the problems for Democrats from moderate to conservative districts — especially the districts captured in the 2006 and 2008 elections. Three-quarters of the Democratic candidates running in the 48 districts carried by McCain in 2009 lost. Tellingly, eight of fifteen who voted no on both health care and cap and trade survived, while only three of sixteen who voted yes on one or the other survived, and all seven of those who voted yes on both bills lost. By pushing highly controversial legislation, the Democratic leadership in the House of Representatives caused the party to lose significantly more seats than they would have from the poor economy alone.
In the analyses that follow we have used standard statistical procedures to estimate the electoral harm of the health care and cap and trade votes.8 These were not the only controversial votes that figured in the campaign, of course, but tarp II had only ten Democrats in opposition and the stimulus only eleven. Moreover, several of these defectors did not seek reelection in 2008, so there is simply not enough variation on these votes to analyze.
We use the vote cast for the member in 2008 to measure his or her electoral vulnerability, and Obama’s 2008 vote in the district to measure district support for Obama. We also include variables for members elected in 2006 and 2008. We expect that the more conservative the district, the more that support for issues like health care and cap and trade hurt Democratic candidates. Conversely, the more liberal the district the smaller the damage from a vote in support of such issues, and in very liberal districts, of course, a yes vote would be an electoral benefit.
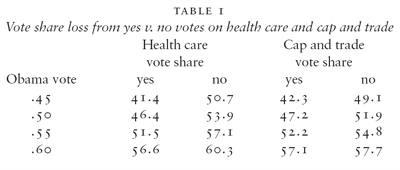
We used four different statistical estimation procedures to insure the robustness of our findings. Tables 1 and 2 report the results most favorable and least favorable to our hypothesis.
From Table 1, yes votes on health care and cap and trade severely damaged Democrats from marginal districts. In districts where Obama got only 45 percent of the vote and the Democratic incumbent voted yes on health care, we estimate a 9 percent vote penalty. At the 50 percent Obama vote level, a yes vote hurts less than it did at 45 percent, but still carries about a 7 percent vote penalty. The more liberal the district, the less it costs to vote yes on either bill. At 60 percent 2008 Obama support the penalty is less than 4 percent. The penalties for voting yes on cap and trade are smaller, and at 60 percent Obama support in 2008 a yes vote becomes a positive.
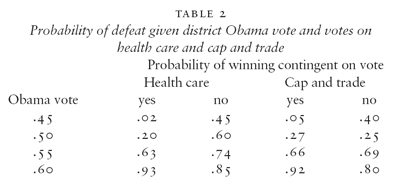
The analysis underlying Table 1 examines the gain or loss in percentage of the vote, but a drop in vote percentage does not automatically translate into loss of a seat, so the analysis that underlies Table 2 examines the probability of winning versus losing a seat. The results are again instructive. Democrats who came from districts where Obama won 45 percent of the vote in 2008 and who voted yes on either health care or cap and trade had almost no chance of reelection compared to a reelection probability of 40 percent or more if they voted no. At an Obama 2008 level of 50 percent reelection probabilities are still two to three times higher for “nay” voters. A “yea” vote on cap and trade becomes a positive factor as the 2008 vote for Obama in the district nears 55 percent, and a health care vote becomes a positive factor as Obama’s 2008 vote climbs from 55 to 60 percent.
While there is something of a gap between these most favorable and least favorable statistical analyses (this is not rocket science, after all), the preceding results clearly indicate that Democrats coming from more conservative districts were hurt by votes in favor of health care and cap and trade. Democrats from districts that had given Obama a big majority in 2008 were helped by a yes vote on either health care or cap and trade, but they were generally likely to win anyway.
How many seats did it cost the president and his party to push for health care and cap and trade legislation? To suggest an answer to that question, we take the statistical equations underlying Tables 1 and 2 and set all Democratic votes on health care and cap and trade at no, which takes away (as much as can be done) the effect of yes votes on health care and cap and trade. In this counterfactual case, where every Democrat opposes these two pieces of legislation, Democrats would have saved between 22 seats (from Table 2) and 40 seats (from Table 1), probably allowing them to save their majority.
Counterfactual exercises like that just reported are problematic in that other things presumed to stay constant would not have stayed constant had rank-and-file Democratic House members voted down health care and cap and trade. In that event they might have provoked primary challenges and/or defections from angry voters in the Democratic base. But this exercise strongly suggests that members from more-conservative districts who supported health care and cap and trade, either out of personal belief or party pressure or both, paid an electoral penalty. The economy and the president’s middling ratings indicated that the Democrats would lose seats. But by advancing controversial legislation the Democratic leadership appears to have turned a probable big loss into one of historic proportions.
Implications for 2012
What does the Republican “shellacking” of Democrats in 2010 portend for 2012? If history is any guide, the answer is not good news for Republicans, at least for the post-World War II period. In 1946, the Republicans gained 55 seats in the house and 12 in the Senate to take control of Congress for the first time in 16 years. Democratic prospects for 1948 looked so poor that Senator Fulbright, a Democrat, proposed that President Truman appoint a Republican secretary of state (next in line for the presidency after Truman’s elevation), resign, and cede the presidency to the Republicans. Contrary to expectations, Truman campaigned against the “do-nothing” Republican Congress and won reelection. A generation later, after the 1994 elections gave Republicans control of Congress for the first time in 40 years, some in the media wondered whether a weakened President Clinton was still relevant. But after two government shutdowns Clinton was reelected overwhelmingly in 1996. The key to understanding how these two new Republican Congresses managed to reelect sitting Democratic presidents lies in the policy choices they made. In the flush of a big victory they overreached.
In the 112th Congress, a key issue will be government spending. The one common principle across all the Tea Party movements in states and localities was that the country cannot afford our current deficits, let alone those looming in the not too distant future. Addressing the deficit problem involves raising taxes, cutting spending, or some combination of the two. Thus far, Republicans have been insistent on cutting spending while keeping the Bush tax cuts in place and enacting no new taxes. In principle, very strong economic growth could increase incomes sufficiently to increase revenue without increasing the tax rate; however, few expect the economy to do this in the near future. Given that the next election will occur before economic growth can solve the problem, the key issue for Republicans is reducing government spending.
While the electorate in 2010 yelled a loud “no” to the policies of the president and Democratic Congress, the negative verdict was by no means carte blanche for Republicans to carry out their own wish list. Given the centrality of spending issues, we conducted a YouGov/Polimetrix poll on sixteen federal programs, asking whether spending on each should be increased, decreased, or kept the same. Table 3 presents the results of this poll.
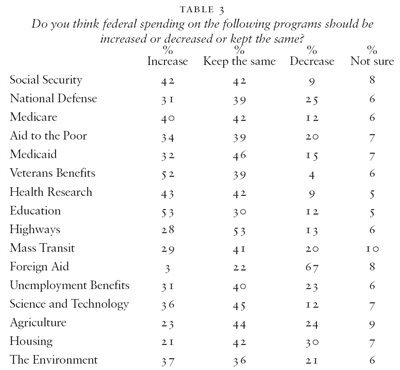
In fifteen out of sixteen programs, a majority of the public would like spending to be increased or kept the same. The only program that a majority of Americans would cut is foreign aid. Most importantly, in the large entitlement programs, Social Security, Medicare, and Medicaid, only small minorities favor the cuts that must come if the budget deficit is to be brought under control. Defense enjoys a similarly privileged status, with 70 percent favoring either current spending or an increase. Even in agriculture and housing, over 60 percent of Americans favor keeping expenditures where they are or increasing them.
Data like these should inform the agenda of the new Republican House majority. In 2010 the country voted no on Democrats, not yes on Republicans, and certainly not yes to across-the-board spending cuts. The new majority faces the hard reality that, in general, voters want spending reduced, but when it comes to specific programs, there are none that stand out, save foreign aid, which, if eliminated entirely, would not dent the deficit of the United States.
Leading the country on a new spending path will require skill and leadership. The obvious place to start is to begin a serious effort to educate the American public about both the seriousness and complexity of the problem. Everything must be on the table. For example, Democrats can no longer label any proposal to slow the growth rate of social security benefits as “unacceptable.” And for their part Republicans must address Ron Paul’s query about why the U.S. has more than 700 military bases overseas. In recent days we have heard a lot about the need to have an “adult conversation” with the American public. That conversation must begin with some serious political leadership.
1 Evan Thomas and the staff of Newsweek, A Long Time Coming: The Inspiring, Combative 2008 Campaign and the Historic Election of Barack Obama (Public Affairs Press, 2010).
2 Robert Borsage and Stanley B. Greenberg, “The Emerging Center-Left Majority,” American Prospect (November 13, 2008), available at http://www.prospect.org/cs/articles?article= the_emerging_centerleft_majority. (This and subsequent weblinks accessed December 17, 2010.)
3 David Brady, Douglas Rivers, and Laurel Harbridge, “The 2008 Democratic Shift,” Policy Review 152 (December 2008 & January 2009).
4 Quoted in Howard Kurtz, “Beware the gop Coronation,” Daily Beast (October 31, 2010), available at http://www.thedailybeast.com/blogs-and-stories/ 2010-10-31/republican-election-wins-will-draw-glowing-press-just-like-obama-once-did/
5 See http://noisyroom.net/blog/2010/11/03/ wipe-out-rush-limbaugh-celebrates- 2010-election/.
6 Maureen Dowd “Republican Party Time,” New York Times (November 3, 2010), available at http://www.nytimes.com/2010/11/03/opinion/ 03dowd.html?ref=maureendowd.
7 See James E. Campbell, ed., “Forecasts of the 2010 Midterm Elections,” PS: Political Science & Politics 43 (2010), 625–648.
8 See David W. Brady, Morris P. Fiorina, and Arjun Wilkins, “The 2010 Elections: Why Did Political Scientists’ Forecasts Go Awry?,” forthcoming in PS: Political Science & Politics 44 (2011).
