- Campaigns & Elections
- Congress
- Politics, Institutions, and Public Opinion
The effect of presidential candidates on congressional election results varies over time, but such effects are generally agreed to be greatest in a president’s first attempt at reelection. What do we know about congressional elections when (as in the 2004 elections) an incumbent Republican president is seeking a second term while leading a party that controls both houses of Congress? In the post–New Deal era George W. Bush is the only Republican so situated. Democratic presidents Roosevelt and Carter were similarly situated in 1936 and 1980—Roosevelt won but Carter lost.
What about a president seeking a second term without having control of both houses of Congress? Republicans Eisenhower (1956), Nixon (1972), and Reagan (1984) and Democrat Clinton (1996) all won reelection, but Republican Bush (1992) lost his reelection bid. What effect did electoral success for the president have on his party’s congressional status? Winning a second term does not switch control of either the House or the Senate majority—presidents without a majority remained in the minority, and those with a majority retained the majority. The effect of minority presidents’ winning on the number of seats varies from Eisenhower’s loss of two seats in 1956 to Reagan’s gaining 15 House seats in 1984, with an average gain of 9 seats. In the Senate these presidents did less well, ranging from Eisenhower’s breaking even to Nixon or Clinton’s loss of 2 seats, with an average loss of 1.25 seats over all these presidents (Eisenhower, Nixon, Clinton). Thus, relative to first-year presidential elections, successful second-term presidential campaigns do not shift much in the way of congressional results.
In regard to candidates losing their bid for a second term, the effect on Congress is greater. When Carter lost in 1980 the Senate went Republican for the first time in 26 years, with Republicans gaining 12 Senate seats and 34 House seats. Thus Carter not only lost his reelection bid, but his party lost control of the Senate and its House majority was significantly reduced. In contrast, when George H. W. Bush lost his bid for reelection, the House and Senate stayed Democratic, with little change. Surely this difference in results is partly due to the fact that Carter led a unified government, as does George W. Bush. Given all the talk that will fill the airways before the 2004 elections, what can we say about the congressional elections of 2004?
Vulnerability and Trends
Pundits, columnists, and television hosts who fill the air with predictions about election outcomes use polls, generic ballot questions, seat-by-seat analysis, intuition, and the herd mentality to foretell results. Our strategy relies on incumbency and open seats—and historical trends—as guides to understanding congressional elections. The idea is simple, and our technique yields similar results for all post–World War II elections and thus has some scientific credibility. Since the 1950s incumbent members of Congress have insulated themselves from national electoral trends by appealing to voters on an individual as well as a partisan basis, giving the average incumbent an 8–10 percent cushion against electoral trends that adversely affect his or her party. This “personal vote” helps explain how Eisenhower, Nixon, Reagan, and Clinton could win presidential elections by large margins and not bring congressional majorities with them. In short, incumbents vote and behave in ways that appeal to their constituents even when those positions diverge from their respective party’s positions.
The personal vote manifests the incumbent’s advantages: more money, greater name recognition, access to the media, free mail to constituents, permanent staff to assist constituents, the ability to bring political heavyweights and celebrities to the district for fund-raising, and so on. It is no wonder that, in the postwar era, members of Congress who seek reelection win more than 95 percent of the time. The hard part, then, is predicting which incumbents are vulnerable. And, to complicate matters, vulnerability depends on national trends. That is, a vulnerable incumbent is even more vulnerable when there is a national swing against his or her party and, of course, less vulnerable when there is a national trend toward her or his party.
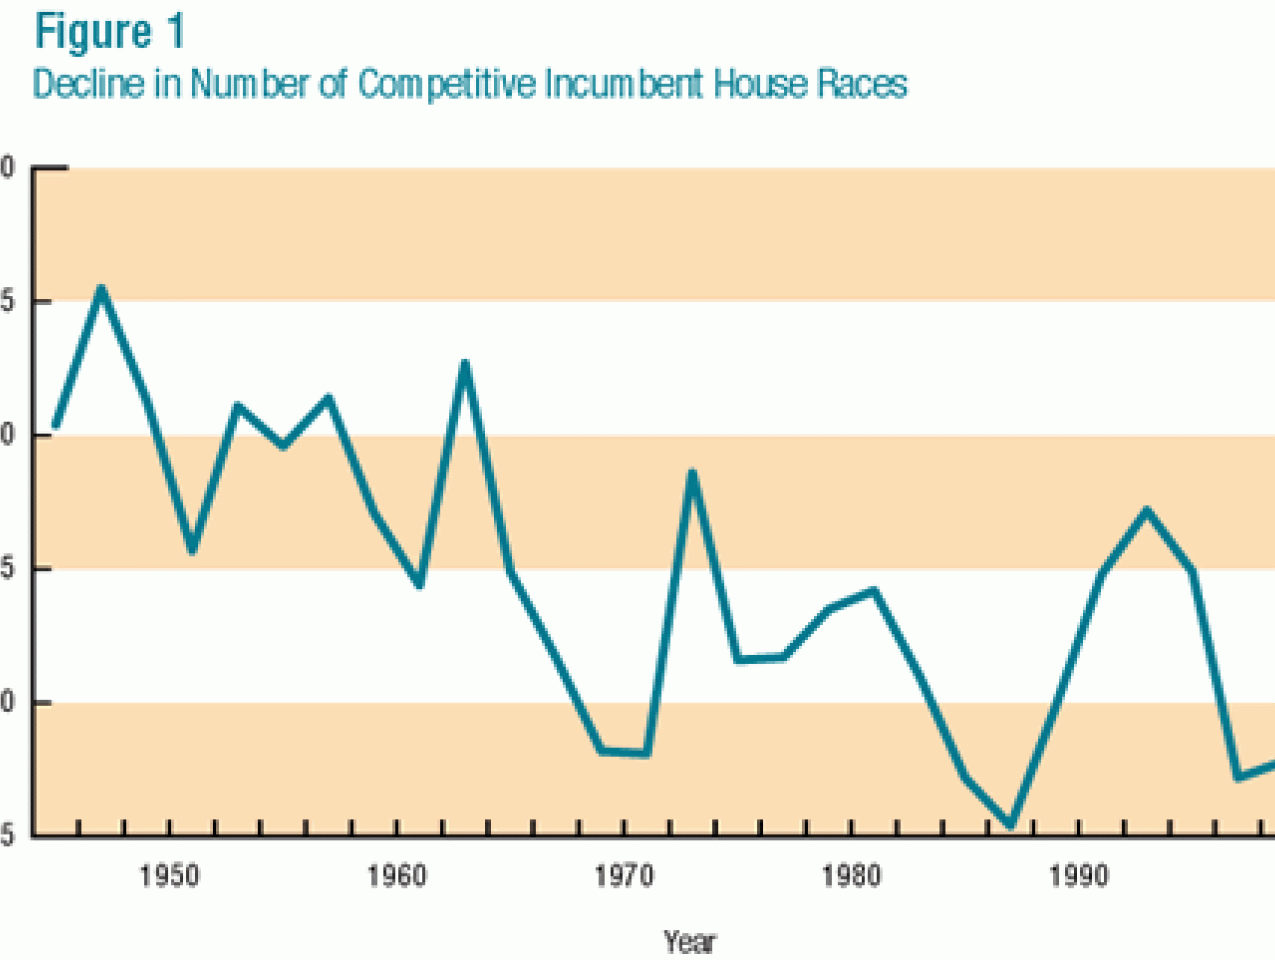
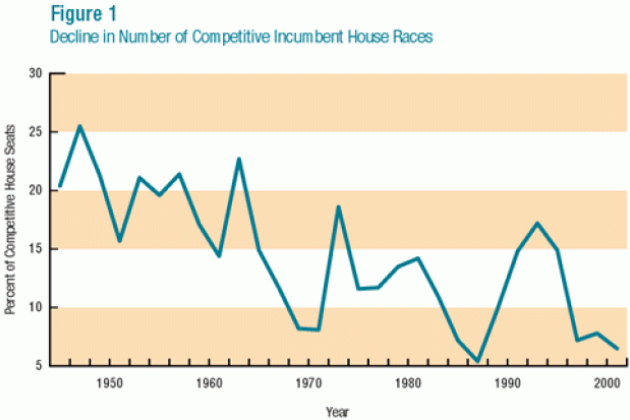
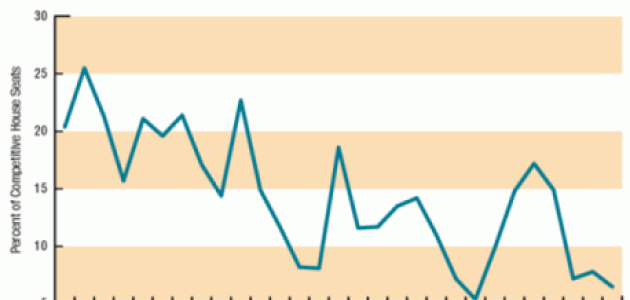
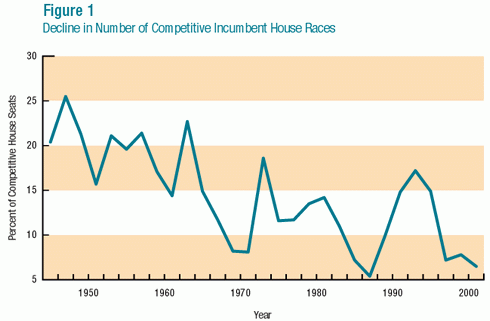
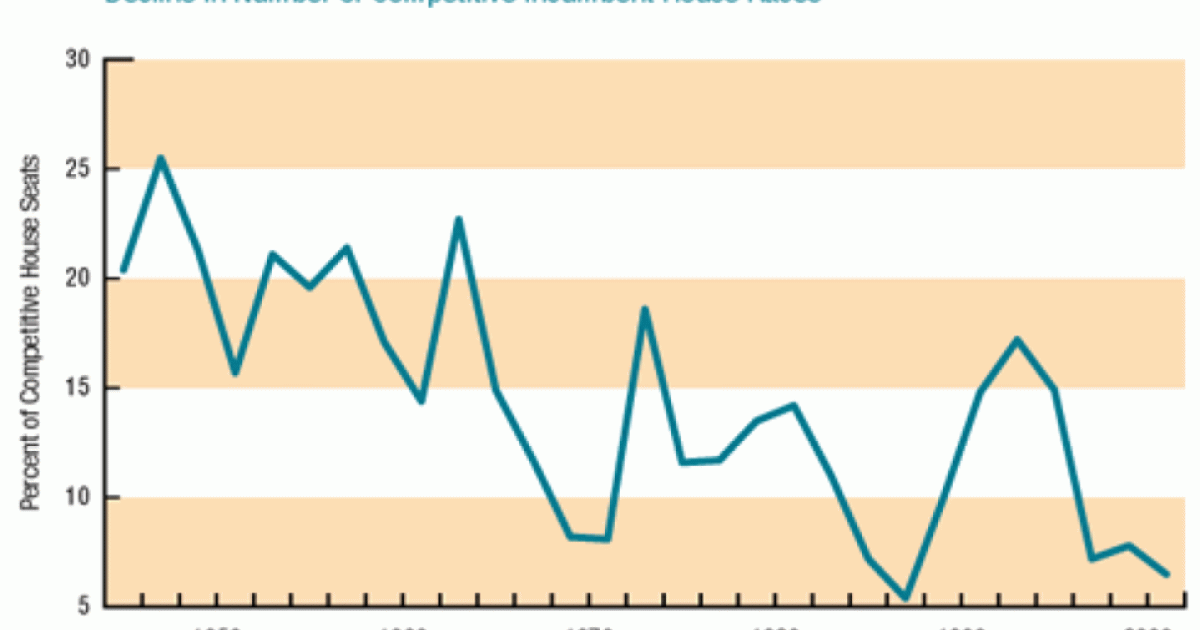
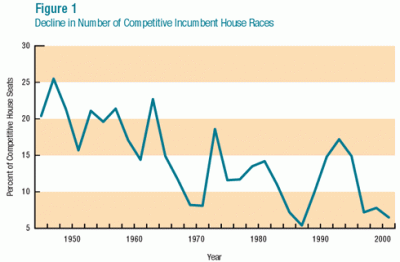
Very few incumbents lose their seats; and in recent years the trend has been toward even less competition and fewer defeats. In the 1950s about 20–25 percent of contested House seats were decided by margins of 10 points or less; in 2000 and 2002 that number was well below 10 percent (see figure 1). Thus it is in the open seats (no incumbent running) where most electoral change occurs. When a House seat opens, a number of events occur: Good candidates decide to run, both parties put money into the campaign, and, most important, the seat typically becomes more competitive. We use the term more competitive rather than simply competitive because some seats are safe for one party even when the seat is open. Thus, as in the case of incumbents, we need to ascertain vulnerability to capture by the other party.
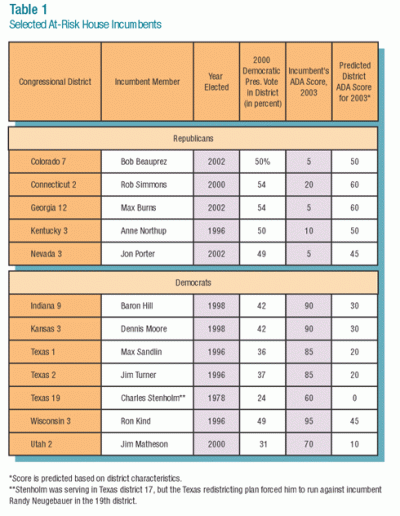
The first step is to analyze presidential voting data for each congressional district, plus some demographic data. This allows us to ascertain the liberal (Democratic) or conservative (Republican) profile for each district. Then we estimate what each incumbent’s ideological record should be, given the profile for his or her district. On the basis of the difference between this predicted value and the actual ideological value for an incumbent (based on scores from Americans for Democratic Action, hereafter ADA), we can identify those incumbents who are “out of step” with their district and thus more vulnerable than other members.
Table 1 displays a sample of “out-of-step” House incumbents who are at risk of losing their seats in 2004. On the Republican side we see that a number of incumbents have 2003 ADA scores at or below 20 (on a scale running from 0 to 100, where 100 is the most liberal and 0 is the most conservative) in districts that are not overwhelmingly conservative. (Note that most of these districts either went for Gore in 2000 or were a dead heat.) Our model suggests that these members “should” have ADA scores around the middle of the range, such as 50 (see the far-right column of table 1), but these legislators are somewhat out of step with their districts and are therefore more vulnerable. A similar logic applies to the Democrats listed in the bottom half of table 1. Not surprisingly, it turns out that the Democratic incumbents who lost were too liberal for their districts and the Republicans who lost were too conservative for their districts. We do not expect all of these members to lose, but this type of incumbent faces the strongest possibility of defeat.
For open seats, we use roughly the same measure of a district’s tendency as we use in incumbent elections to estimate the chances that an open seat will go with one party or the other. Having measured the vulnerability of open and incumbent seats in this way, however, does not solve the problem of trends. A political trend toward one party will affect the election results by tipping close races in that direction. Trends cannot be predicted precisely because they are subject to exogenous shocks to the election such as a terrorist attack in September. Thus we try to estimate trends using past elections and allowing the trends to vary between Republicans and Democrats.
House Projections
To solve this trend problem, we used the average of several elections that plausibly represented trends—some for Democrats and some for Republicans. All elections featured an incumbent president’s bid for reelection: 1992 and 1996 for Democratic trend years, and 1956, 1972, 1980, and 1984 for Republican trend years.
Republican Trend
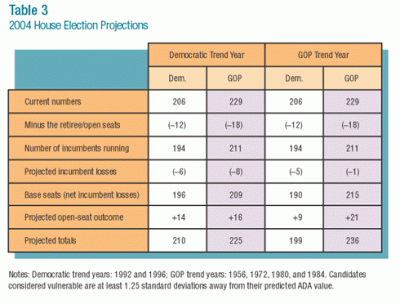
Under the conditions of a Republican trend, the vulnerable seats yield the Republicans a net 8-seat gain, giving the party a 215-to-190 advantage in base seats (see table 3). The 30 open seats, combined with the probability that an open seat changes hands in a Republican year, yield a 21-to-9 Republican advantage in the open seats and a 236-to-199 Republican House.
For there to be a Republican trend the party would need as favorable a set of issues as it had in 1980 or 1984 to move voters toward it. The only issues we see as capable of generating any Republican swing are those surrounding 9/11 and homeland security. The president’s jump in popularity after 9/11 has obviously decayed, and though Republicans are generally perceived as better on this issue than Democrats, their advantage has lessened considerably. The Democratic incumbents’ strategy has been to be very supportive of the troops and—to a lesser degree—the president on security issues. Vulnerable incumbents have supported the president on national security issues, and have thus been fairly successful at negating any advantage Republicans might have due to terrorism and security issues. Thus we believe that the national security issue will not ultimately result in a strong Republican trend.
Democratic Trend
In the event of a Democratic trend year, we project that Democrats will gain a net of 2 seats (8 Republican and 6 Democratic incumbents losing), giving the Democrats a base of 196 seats. Predicted gains for open seats give the Democrats 14 of the 28 open seats. But these small gains would not be enough to produce a Democratic House majority. Democrats would merely narrow the margin of control in the 109th Congress: 210 Democrats and 225 Republicans. The “magic number” for Democrats to regain control of the House is a net gain of at least 12 seats, but the model suggests that Democrats might not net even half that many seats.
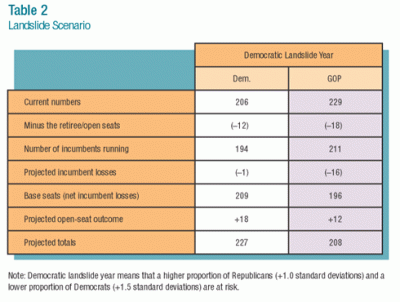
Because of the uncertainty associated with Iraq and terrorism there is a slight possibility of a Democratic landslide (see table 2). In the table we assume that, for some exogenous reason, Republicans are inherently more vulnerable than Democrats. Under these conditions, Democrats pick up a net gain of 15 seats via incumbent losses, giving them a base seat advantage of 209 to 196. They also do significantly better in the open seats—capturing 18 of the 30 open seats—giving the Democrats 227 seats and control of the House for the first time since 1994.
For this scenario to occur the Democrats need a powerful issue and, with the economy performing reasonably well, this seems the least likely of the scenarios. A terrorist attack that can be blamed on an inattentive administration or really bad news from Iraq (for example, a civil war where Sunnis and Shiites massacre each other), however, could swing significant numbers of voters toward the Democrats.
The Prognosis
In all likelihood, the final numbers in the 2004 election will lie between the two more typical trends in table 3 because there will be no massive partisan trend and there is little chance of a landslide. In this case, the 194 and 211 Democratic and Republican incumbents go relatively loss-free, with each party holding almost all of its incumbent seats. In fact, given some of the mid-census redistricting in Texas, the Republicans might actually pick up a couple of unexpected seats. In that case, the election will turn on the 30 open seats (with no incumbent running), which tend to be Republican districts. Probably fewer than a quarter of these open seats would change hands, and the Republicans would essentially maintain the same level of control over the chamber they currently have.
Under any of these scenarios—including the landslide—the congressional elections will be close. Given the history of elections where a president seeks reelection, we see only the slightest chance of a shift in chamber control. More likely this will be a status quo congressional election, with little change and few fireworks.
Senate Projections
Elections in the Senate are not as predictable. First, the incumbent reelection rate is considerably lower. Second, the money difference between challengers and incumbents is not prohibitive. Third, Senate campaigns in most states are media events; thus it is easier for challengers to overcome incumbent advantages. And, finally, voters pay more attention to Senate elections than to House races. Given this, here we list the vulnerable Democratic and Republican seats (see table 4), offer our opinion on the likely outcomes, and then add up the results.
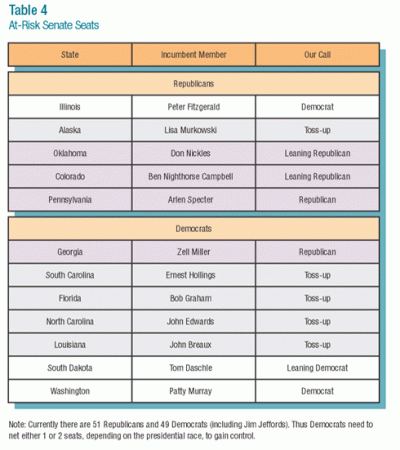
There are 34 Senate seats up for election this year—19 Democrats and 15 Republicans. Eight Senators are retiring (5 Democrats and 3 Republicans); thus of the 34 seats up for reelection, 14 are currently held by Democrats and 12 by Republicans. In Georgia, Democrat Zell Miller’s seat will almost certainly go to the Republicans. But Democrats are almost certain to pick up a seat in Illinois, where Barack Obama is aiming to replace Peter Fitzgerald. (Jack Ryan, Obama’s challenger, was forced from the race in mid-June over a sex scandal. Alan Keyes entered the race in August.) If Obama succeeds, as expected, he will be the only African American in the Senate.
For Democrats to win back the Senate they will need to hold on to the four other Southern seats being vacated: those of Ernest Hollings (SC), Bob Graham (FL), John Edwards (NC), and John Breaux (LA). Beyond this few Democratic incumbents are in real danger—probably only Tom Daschle (SD) and Patty Murray (WA)—who, if they run sharp campaigns, should retain their seats.
Because the Senate is so close (51–49 for the Republicans), the Democrats could possibly take the Senate. But to do so they would need to hold onto at least three of the five open Southern seats and could not afford a loss in South Dakota or Washington. If either of those seats fall to the Republicans, a Republican Senate is more or less guaranteed in the 109th Congress. A key problem for Democrats is that Republicans have fewer open seats at risk: only those of Ben Nighthorse Campbell (CO) and Don Nickles (OK). Moreover, both of those seats probably lean Republican. In Alaska, Lisa Murkowski is running to retain the seat that she was appointed to by her father (the former senator and now governor of Alaska). Thus, although technically an incumbent, she has not previously stood for election and will face a tough race against Democrat Tony Knowles (a popular former governor). But most other Republican Senate seats seem fairly safe. Thus we see only marginal chances for Democrats to gain seats. To achieve chamber control, they would need a one-seat gain were Kerry to win the presidency (because Vice President Edwards would break the tie in favor of the Democrats) and a two-seat gain were Bush to retain his office. It seems more likely that Republicans will make minor gains (perhaps a seat or two) in the open Southern seats and hold onto seats elsewhere. Under this scenario, Republicans would hold or slightly widen their margin of control.
The parties will spare no expense to win this heated election. And most of those resources will be channeled into the most competitive states. Any small trend toward either party could tip these races, which means that the Senate majority could be controlled by anywhere from 51 Democrats to 54 Republicans. The final outcome will probably hinge on one or two seats at most—with an evenly divided Senate as a strong possibility. This election will no doubt continue the recent series of elections, whereby the parties are very evenly balanced and control hangs on only one or two seats.


