


- Economics
Editor’s note: This essay is adapted from a post, “8 heresies of monetary policy,” which originally appeared on the author’s blog, The Grumpy Economist.
This first graph reminds you of the current situation and recent history of monetary policy.
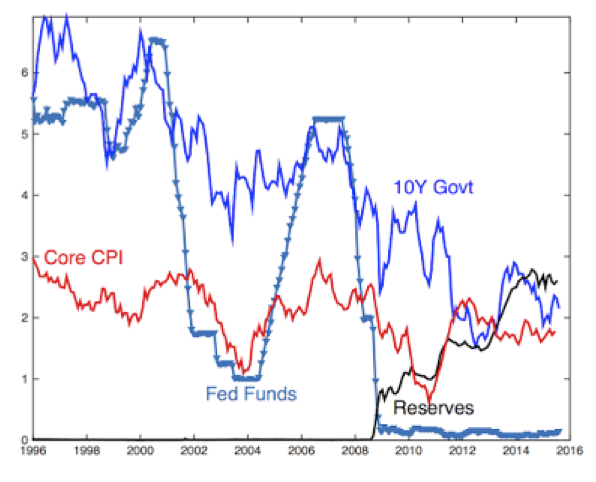
The federal funds rate is the interest rate that the Federal Reserve controls. The funds rate rises in economic expansions, and goes down in recessions. You can see this pattern in the last two recessions. Since about 2012, though, when, following history, you might have expected the funds rate to rise again, it has stayed essentially at zero. Very recently it has started to rise, but very slowly, nothing like the funds rate increases in 2005.
The black line is reserves. These are accounts that banks have at the Fed. Crucially, these bank accounts now pay interest. Starting in 2008, reserves grew dramatically from about $20 billion to $2,500 billion. The three cliffs are the three quantitative easing episodes. Here, the Fed bought bonds and mortgage-backed securities, giving banks reserves in exchange.
Inflation initially followed the same pattern as in the last recession. It fell in the recession, and bounced back again in 2012. Inflation has been slowly decreasing since, though it is picking up very slightly to 2% as I write in February 2018. Ten-year government bonds have quietly trended down for 30 years, with a bit of an extra dip during the recession.
The next graph plots US unemployment and GDP growth.
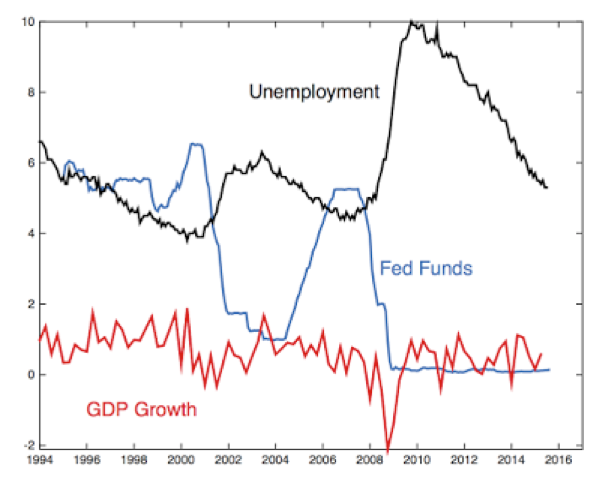
You can see we had a deeper recession, but then unemployment recovered about as it always does, or, if anything, a little faster. You can see the big drop in GDP during the recession. Subsequent growth has been overall too low, in my view, but it has been very steady. Both growth and inflation are steadier in the era of zero interest rates than they were when the Fed was actively moving interest rates around.
These central facts motivate my heresies: Inflation, long-term interest rates, growth, and unemployment seem to be behaving in utterly normal ways. Yet the monetary environment of near-zero short-term rates and huge quantitative easing is highly unusual. How do we make sense of these facts?
Heresy 1: Interest rates
- Conventional Wisdom: Years of near zero interest rates and massive quantitative easing imply loose monetary policy, "extraordinary accommodation,'' and "stimulus.''
- Heresy 1: Interest rates are roughly neutral. If anything, the Fed has been (unwittingly) holding rates up since 2008.
What does a central bank look like that is holding interest rates down? Such a bank would lend money to banks at low interest rates, that banks could turn around and re-lend at higher interest rates. That's how to push rates down. What does a central bank look like that is pushing rates up? Such a central bank takes money from banks, offering to pay banks a higher interest rate than they can get elsewhere.
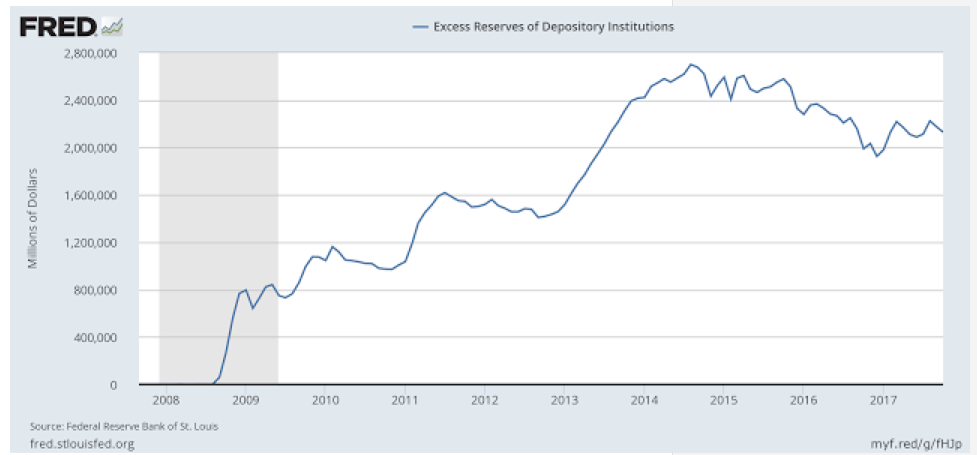
What's our central bank doing? In bigger format, the top panel of the next graph presents excess reserves. This is money that banks voluntarily lend to the Fed, and on which they receive interest.
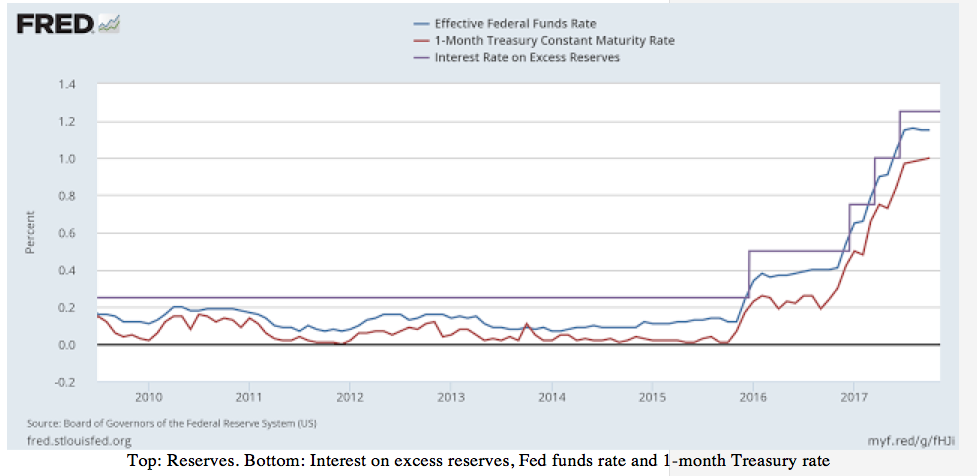
The bottom panel is the interest that the Fed pays on excess reserves, along with the Federal Funds rate and the rate on one-month treasurys, to give a sense of market rates. As you can see, the Fed pays more than banks can earn elsewhere. So, on this basis, the Fed looks like a central bank pushing rates up.
Now, as we used to say at the University of Chicago—that’s fine in the real world, but how does it work in theory? How can it be that zero interest rates—lower than we have seen since the Great Depression—are not an unusual stimulus?
Well, it's certainly possible. Remember, the nominal interest rate equals the real interest rate plus expected inflation. If the real interest rate is, say -1.5%, and inflation is +1.5%, then a nominal interest rate of zero is neutral. Past times of higher “normal” nominal rates had higher real interest rates and higher inflation.
And, there are plenty of reasons to suspect that the "natural'' real rate of interest has been negative for much of the period since the financial crisis. More savers than investors, low marginal product of capital in a real slow growth environment, and so on are easy stories to tell. In this view, by the way, as the real rate recovers along with the economy, if the actual nominal interest rate is stuck at zero, then inflation should gently decline. That is also what we have seen until recently. In the last few months, slightly higher nominal rates accommodate slightly higher real rates and slightly higher inflation.
Plus, after 8 years, if monetary policy were really “stimulating” quite so much, where is the inflation and boom?
Heresy 2: Quantitative easing
As we have seen, in its quantitative easing (QE) the Fed bought nearly $3 trillion of Treasurys and mortgage backed securities, giving banks interest-paying reserves in return.
- Conventional Wisdom: QE lowered long-term interest rates, and provided a big stimulus. QE's stimulative effect is permanent and continues to this day, so unwinding QE is vital to "normalizing'' policy.
- Heresy 2: QE did basically nothing to interest rates, or to stimulus.
The next graph is a plot of ten-year rates and mortgage rates along with reserves. Again, the steep rises in reserves are the QE episodes.
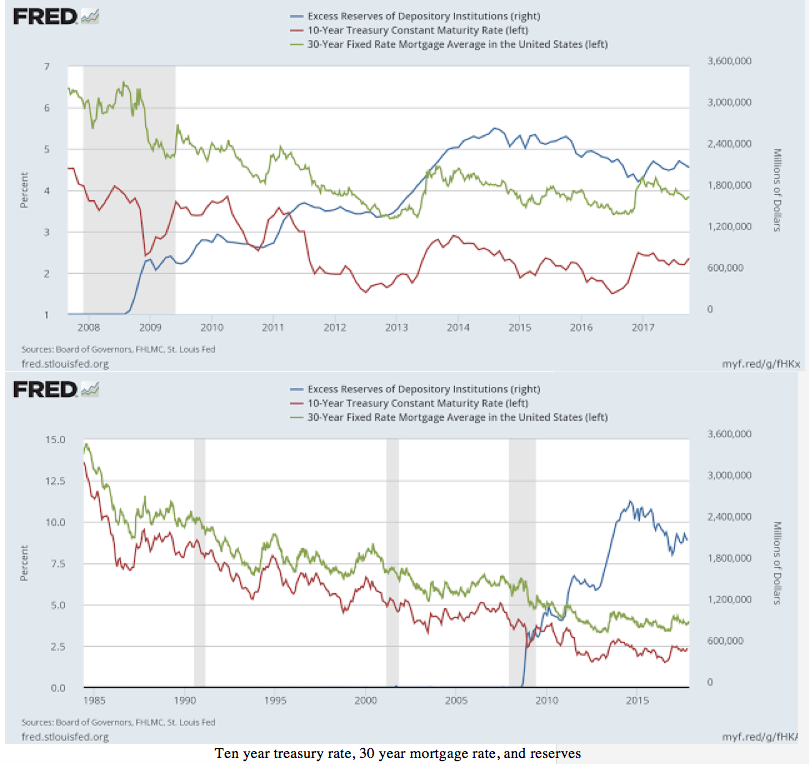
Maybe the first QE is associated with a one-percentage point drop in rates. But interest rates bounce right back. Large transactions can move prices, but in the rest of finance we see this “price pressure” as a temporary, not a permanent movement. In the second and third QE, interest rates rise during the QE episode, exactly the wrong sign.
The bottom panel takes a longer view of interest rates Here you can see again that interest rates have been on a steady downward trend since 1985. Can you see any difference in the behavior of these interest rates during the QE period from the late stages of the last three expansions? I can’t.
Well, again, so much for the real world—is there a reason to expect QE will work? As Ben Bernanke himself recognized, QE “works in practice’’ or so he thought, but not in theory. We should worry about any proposition that has no theoretical basis. Sometimes facts are ahead of theory, but unexplainable phenomena usually turn out not to be there.
The Fed is in essence a huge money market fund. Banks sell bonds to the Fed, and get in return a money market account, backed by the Fed’s holdings of the bonds. Just how much difference does it make for banks to hold treasurys through the Fed rather than to hold treasurys directly? We can think of QE as open change operations. Reserves are just another form of government debt. So it’s as if the Fed took a bunch of your $20 bills and gave you two $5s and a $10 in exchange. It’s hard to see that having a big effect on your spending.
QE theory is a catch-22. The usual story told is that bond markets are “segmented.’’ The 10-year treasury market is cut off from other markets. Then, if the Fed buys a lot of them it can raise the prices of 10-year treasurys. But the point of QE was not to lower Treasury rates, it was to lower rates that might influence investment. To affect the economy, the markets must not be segmented. For the Fed to affect the 10-year rates, they must be segmented. For the Fed to affect the economy, markets must not be segmented. If QE affects the economy, it can’t affect 10-year rates.
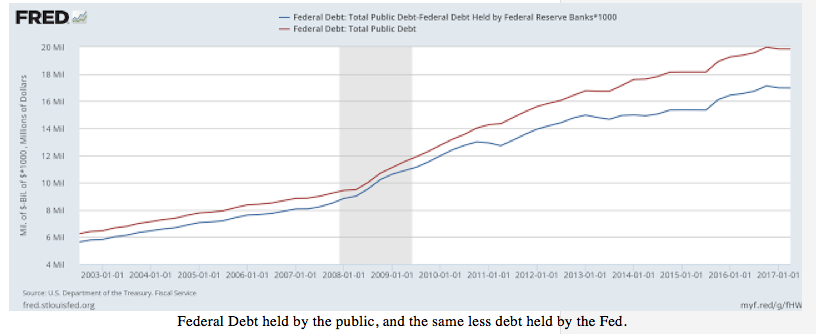
Finally, the Treasury has been selling faster than the Fed has been buying. The next graph has all federal debt, and federal debt less the part bought by the Fed. That bottom line is still growing. So, the Fed did not remove any bonds from the market. Overall, markets held more long-term debt, not less.
Moreover, the Treasury was trying to move to a longer maturity structure. Treasury debt is much like your mortgage. If you take the 30-year fixed, you protect yourself against interest rate increases. If you take the floating rate ARM, you get a lower rate, but if rates go up, you might be in a squeeze. The Treasury chose the fixed rate, trying to move to longer bonds. The Fed bought those long bonds right back up, issuing short-term debt (reserves) instead, and undoing the interest-rate insurance that the Treasury bought. Fed and Treasury need to get together and decide who is in charge of the maturity structure!
Heresy 3: Low rates, QE and financial markets
- Conventional Wisdom: QE and low interest rates set off a "reach for yield,'' "asset price bubbles,'' though artificially low risk premiums.
- Heresy 3: The risk premium is not unusually low for this stage of the business cycle. In any case, the Fed has nothing to do with risk premiums.
A quote from one of my otherwise favorite financial analysts expresses the view nicely: "QE and negative interest rates manipulated prices of risk-free assets, and by artificially boosting risk-free assets central banks have sent investors on a hunt for yield, which in turn artificially boosted prices of risky assets and significantly distorted prices in financial markets.''
This story gets passed on and on, but does it line up with the facts, and does it make any sense?
Risk premiums are about the spread between borrowing and lending. You take on risk by borrowing to invest. Now, if you borrow at 1% and lend at 3%, that is exactly the same risk and return as borrowing at 3% and lending at 5%. Risk taking depends on the spread between risky and risk-free rates, not the level of rates.
Yes, we can cook up stories, involving the affairs of specialized intermediaries. But recognize those are second-order stories, and it’s hard to get risk premiums on widely traded stocks and bonds to go substantially wrong for years.
Let's look at the facts. Are there unusually low risk premiums or high asset prices, and are those tied to low interest rates or QE?
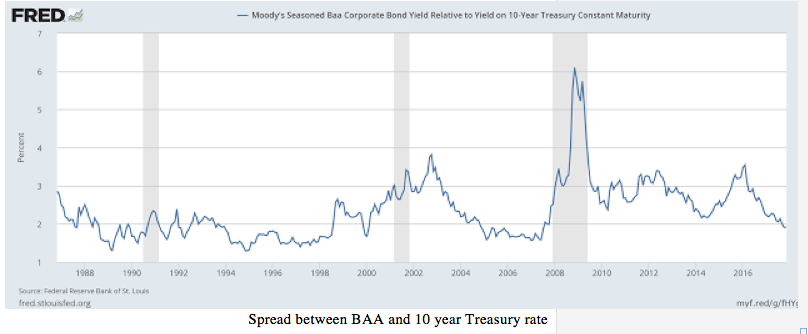
This graph is the interest rate spread between Baa corporate bonds and 10-year treasurys, a sign of the premium for holding the risk of corporate defaults. The premium is low now. But we are in the late September of the business cycle, and the corporate spread was even lower in each of the last three business cycles.
Risk premiums are always low in late stages of the business cycle. Risk is low, people are doing well, and willing to take risks despite low premiums. In fact, corporate premiums are still surprisingly high for this stage of the business cycle, a fact often attributed to bank's unwillingness to trade much under the more stringent capital standards. So much for the bubble.
The next graph presents economist Robert Shiller's long-run price/earnings ratio. The price/earnings ratio is high. But it's also always high at the late stage of expansions, as people are more willing to take stock market risk in good times.
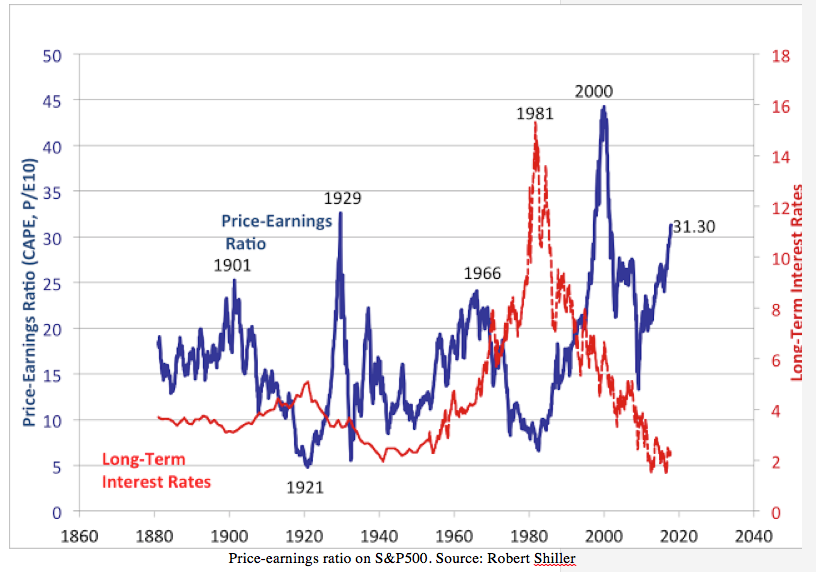
The price-earnings ratio still seems high, but the price earnings ratio reflects the level of interest rates as well as the spread. The classic Gordon growth formula states that the price/earnings ratio equals one divided by the stock's rate of return minus the growth rate of dividends. We can also break down the stock rate of return into a real risk-free rate and a risk premium. Use the standard Gordon growth formula that the price earnings ratio is one divided by the expected return minus the dividend growth rate. Suppose the real risk free rate goes down by one percentage point, leaving the risk premium alone. If the price/earnings ratio starts at 25, or expected returns four percentage points above growth, a 1% decline in real rate gives a price/earnings ratio of 33 with no change in risk premium. That's just about the amount by which the price/earnings ratio is unusually high. In sum, the price-earnings ratio sensibly reflects lower real interest rates all on its own. There is no evidence that the low interest rate is also lowering the risk premium in stocks, and pushing prices higher still.
Heresy 4: Real rates
All of my heresies revolve around the question of low interest rates, and you might object that yes, interest rates are low, but that's because you think the Fed is keeping interest rates low.
- Conventional Wisdom: The Fed is the primary force behind movements in the real rate of interest and GDP growth rates.
- Heresy 4: The Fed has little to do with real interest rates or economic growth rates .
This is just economics 101. If people are impatient, you have to pay them higher interest rates to get them to save. If the economy is growing quickly, and people know they will be better off in the future, you have to pay them higher interest rates to get them not to consume today. And the interest rate is determined in the end by companies' ability to make real returns from borrowed money.
As we go into an economic expansion, with higher growth, real interest rates will naturally rise, Fed or no Fed. As we go into a period of low or no growth and poor investment opportunities, real interest rates will be low, Fed or no Fed. And after a few years, growth comes from productivity only, not anything the Fed can arrange.
Now, there are many stories told for low growth and low "natural '' real rates—a "savings glut,'' a demographic bulge of middle age savers, low investment productivity from distorting taxes and regulation, and so on. Moreover, real rates are low everywhere in the world. It isn't specific to the Fed.
In sum, the Fed is nowhere near as powerful as conventional wisdom suggests.
