The debate about California’s Propositions 30 and 38 has zeroed in on what has become the crux of a much larger (and unsettled) debate – the state of education in the Golden State. Beginning with discussion of Californians’ existing tax burden, the debate transitioned quickly to student and teacher performance in the classroom. Naturally, number-spinning has been full force as each side offers competing measures of California’s K-12 performance compared to other states’.
Both Prop 30 (sponsored by California Gov. Jerry Brown) and Prop 38 (sponsored by Pasadena attorney/activist Molly Munger) propose tax increases for Californians. Proponents of both ballot measures say that the new revenue will go to classrooms, thereby helping to improve K-12 performance. That, in turn, has sparked a debate over how best to measure educational performance and whether increased funding leads to improved performance.
(Brown’s initiative (details here) would raise $5-$7 billion a years, for five years, by raising the state’s sales tax and income taxes on the state’s wealthiest residents. Munger’s proposal (details here) would increase income taxes on all but the state’s poorest residents, giving an estimated $10 billion annually to schools.)
A recent debate on the Stanford campus underscores the rivalry between the competing measures. Pro-30 Don Dawson of the California Teachers Association and pro-38 Carol Kocivar of the California State PTA argued that each of their propositions would restore funding to California’s underfunded and woefully underperforming classrooms. Kocivar repeatedly invoked a 2012 Education Week study that ranked California 47th in per-pupil spending. “We’re funding our schools at 47th in the nation. We’re in the basement. The philosophical premise [of Prop 38] is that we cannot continue to do this. We cannot continue to deny an entire generation of children the education they deserve,” said Kocivar.
Former U.S. Assistant Secretary of Education Bill Evers and anti-38 Eric Hanushek (both Hoover Fellows) argued that further taxing Californians and diverting revenue to education would not solve the system’s core problem – ineffective teachers. “[The problem] is not the funding. It’s the ineffectiveness,” said Evers.
Combatting Kocivar’s per-pupil spending statistic, Hanushek noted that it took into account per-pupil spending adjusted for regional differences. Instead, he argued that California ranks 34th in unadjusted per-pupil spending and 47th in achievement (California actually ranks 35th in per-pupil spending,according to the Census Bureau).
“People like to adjust spending to make it look like we’re worse off, but we’re spending 34th in the nation. But the problem is not that,“ said Hanushek. He cited his 2008 study “Getting Down to Facts,” done with Stanford’s School of Education: “22 different research projects by people from all over the country contributed to this. The bottom line – said explicitly with no hesitation – was just putting more money into the system would do nothing for achievement.”
The exchange was intriguing. Regarding per-pupil rank, the difference between 35th and 47th is actually a significant one. While ranking 35th means that the state is somewhat below the middle of the pack, ranking 47th means that the state is at the bottom of it. And with the U.S. education system already underperforming compared to the rest of the world, neither speaks particularly highly of California’s system.
But ranking 35th undercuts the argument that California’s system is drastically underfunding its education system compared to the rest of the country. According to the Census Bureau, unadjusted, California spent $9,375 per pupil in 2009-10, or $1,300 below the national average $10,675. According to EdWeek, adjusted, California’s spending $8,667 per pupil, or $3,000 below the national average $11,665.
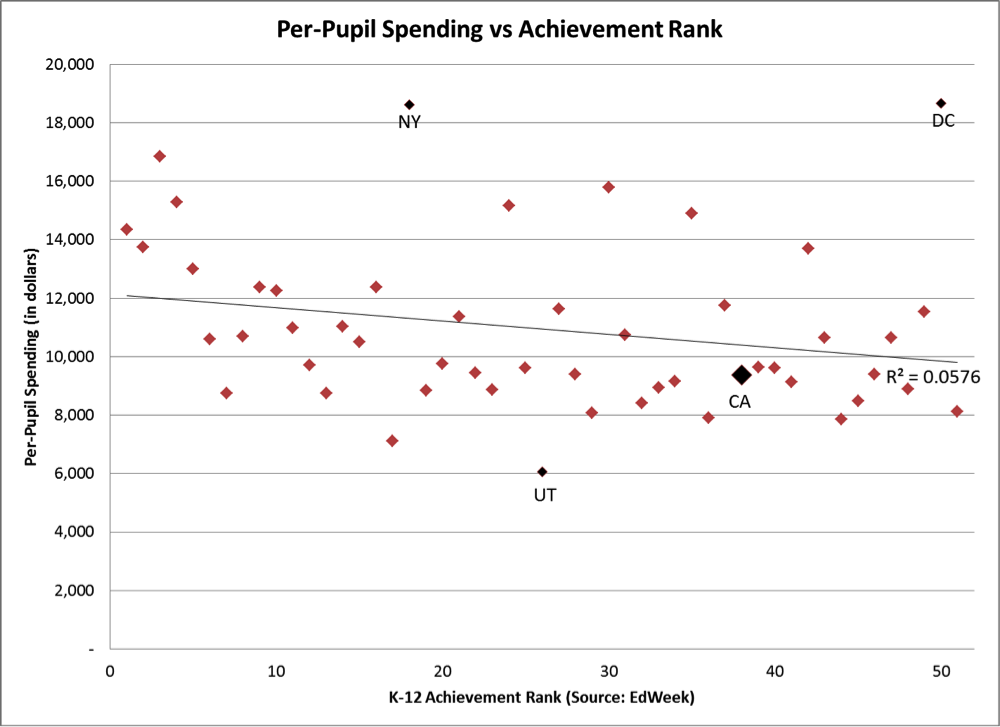
Is there was any correlation between unadjusted per-pupil spending and EdWeek’s achievement rankings? In the chart, r= -0.24, indicating a weak correlation between the per-pupil spending and achievement rankings (It’s important to note that correlating spending with rank cannot fully capture variation among achievement because rankings capture relative performance. Additionally, EdWeek’s rankings are only one measure of in-classroom performance among many, but given that Monday’s exchange centered on EdWeek’s, it’s useful to use its own rankings in this analysis.)
California, ranking 38th in achievement in 2010, actually sits fairly close to the trend line. But states vary widely in how close they sit to it. Indeed, some outliers are extreme. The District of Columbia, for example, spends the most per pupil ($18,667) and ranks 50th in achievement. But New York, spending nearly the same ($18,618), ranks 18th in achievement. Utah, spending just $6,064 per pupil, ranks 26th in achievement. With these and so many other achievement and education spending metrics, this debate is likely to remain murky.
Speaking of murkiness, that takes us back to the competing California ballot measures. While Proposition 38 ensures in a given year that at least 60% of the new revenue it raises goes to K-12 education, Proposition 30 contains no guarantee that it will increase funding for K-12 education. While the revenue for Prop 30 will be spent on education, the Legislature can take other revenue and allocate it elsewhere in response to balance the budget.
All this murkiness will undoubtedly play a significant role in the larger debates over Props 30 and 38. And so much number-spinning will likely make voters dizzy as they attempt to determine how much funding would actually make it to the classroom under each proposition and whether that money would truly improve California’s education system.
The good news: In a week, we’ll know what they decided.
Autumn Carter is executive director of California Common Sense, a non-partisan non-profit dedicated to opening government to the public, developing data-driven policy analysis, and educating citizens about how their governments work.


