


- Politics, Institutions, and Public Opinion
- State & Local
- California
For more than a quarter century after World War II, the "California Dream" was real. California was the Promised Land to millions of middle-income households who moved here from all over the country. They were attracted by unmatched weather.
The house – the largest item in household budgets – was affordable to middle-income households, as it was in the rest of the nation. This remained the case from 1950 to 1970, according to U.S. Census data. Median house values rarely reached more than three times median household incomes in today's 52 over-a-million-people U.S. metropolitan areas. The highest was a 3.6 value-to-income ratio in 1950, in Hartford, Connecticut.
Things began to change in the 1970s. California's state and local governments set about developing a maze of environmental and land-use regulation that drove house prices to record levels. The value-to-income ratio exceeded 4.0 or more in the Los Angeles, San Francisco, San Diego, and San Jose metropolitan areas by 1980, but nowhere else among the other 52 U.S. metropolitan areas. Statewide, the ratio reached 4.2 in 2000, more than 50 percent above the national average of 2.7. This meant that Californians could expect to pay an amount equal to 1.5 years of income more than their peers in the rest of the nation.
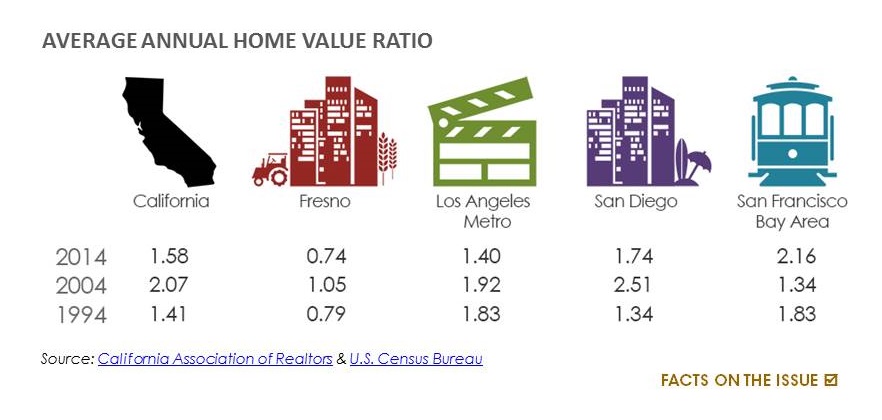
Middle-income housing affordability (as well as low-income housing affordability) became even more severe after that. During the housing bubble, house values escalated to 8.9 times incomes, 130 percent more than the national average. Then came the bust and huge losses as the state led the nation in precipitating the worldwide Great Recession.
Moreover, even after reaching bottom, house values have not returned to their pre-bubble levels relative to incomes. California's value-to-income ratio was 85 percent above the national average in 2013, according to Census Bureau data. Since that time, things have gotten worse.
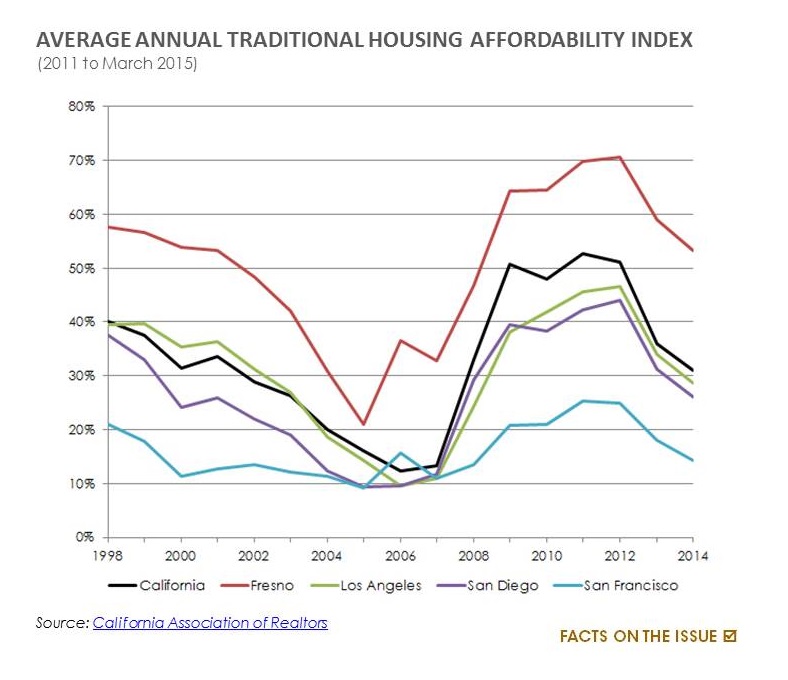
According to California Association of Realtors data, California median house prices have increased nearly 25 percent since 2013 – far more than incomes. In the Bay Area (San Francisco and San Jose metropolitan areas), house prices increased $173,000, a stunning figure that equals the median value for all houses in the United States in 2013. The price increases are not limited to the coastal markets. As people flee the Bay Area for less unaffordable housing, prices have been driven up more than 40 percent in San Joaquin County (Stockton) and Stanislaus County (Modesto). In Fresno, one of the least unaffordable places left in the state, prices were up one-third.
Just since 2000, the state has sent more than one million domestic migrants out than have arrived. This is not surprising, since in many metropolitan areas, house prices are less than one-half that of California relative to incomes.
The LAO identified the regulatory maze as principally responsible for California's housing affordability crises. This is basic economics. When the supply of a demanded good, such as land for housing, is severely restrained, prices rise (other things being equal). That has happened with a vengeance in California. The restrictions include environmental regulations and urban planning measures, such as urban containment policy.
But this is much more than a simple issue of markets versus planning. The issue is people and the impact of these policies on standards of living and poverty levels. The result has been a profound public policy failure.
A state long known as a land of opportunity has become a locus of poverty. California's policies have produced the highest housing-cost adjusted poverty rate in the nation. It should be embarrassing that California's housing-adjusted poverty rate is now 50 percent higher than Mississippi’s and nearly double that of West Virginia’s – states long belittled for their levels of poverty.
The statewide middle-income housing affordability crisis is bad enough, with a 6.2 ratio. It is much worse for the state's growing minority populations. For African Americans, the value-to-income ratio was 9.1 in 2013 and for Latinos, 8.1. Of course, for White Non-Hispanics the ratio is 5.3, still far too high. This has serious social implications. Brandeis University research shows a widening wealth gap for African Americans relative to Whites and at least as great a gap for Latinos. According to Brandeis University, the greatest potential for reducing this gap is increased access to home ownership for minorities.
Outside maintaining order, the most important obligation of state and local governments may be to establish a framework conducive to higher standards of living and to less poverty. Yet, California's policies drive up housing costs, which reduces discretionary income. Discretionary income – what is left over after taxes – defines the standard of living and poverty.
Sadly, the lesson has not been learned. The fine- sounding "Sustainable Communities Strategies" under Senate Bill 375 are being used to place even stronger restrictions on housing. Things could get much worse.

Senate Bill 375
The Sustainable Communities and Climate Protection Act of 2008 (SB 375) targets passenger vehicle greenhouse gas emissions by giving the Air Resources Board authority to set regional emission targets. California’s eighteen regions must then develop a Sustainable Communities Strategy – consisting of transportation and land-use/housing policies – to achieve the emission mandates. Regions have typically adopted enhanced public transportation, bike and carpool lanes, and walking trails/sidewalks transportation policies as well as infill housing development and urban redevelopment policies to implement their strategy plans.
