- Politics, Institutions, and Public Opinion
- State & Local
- California
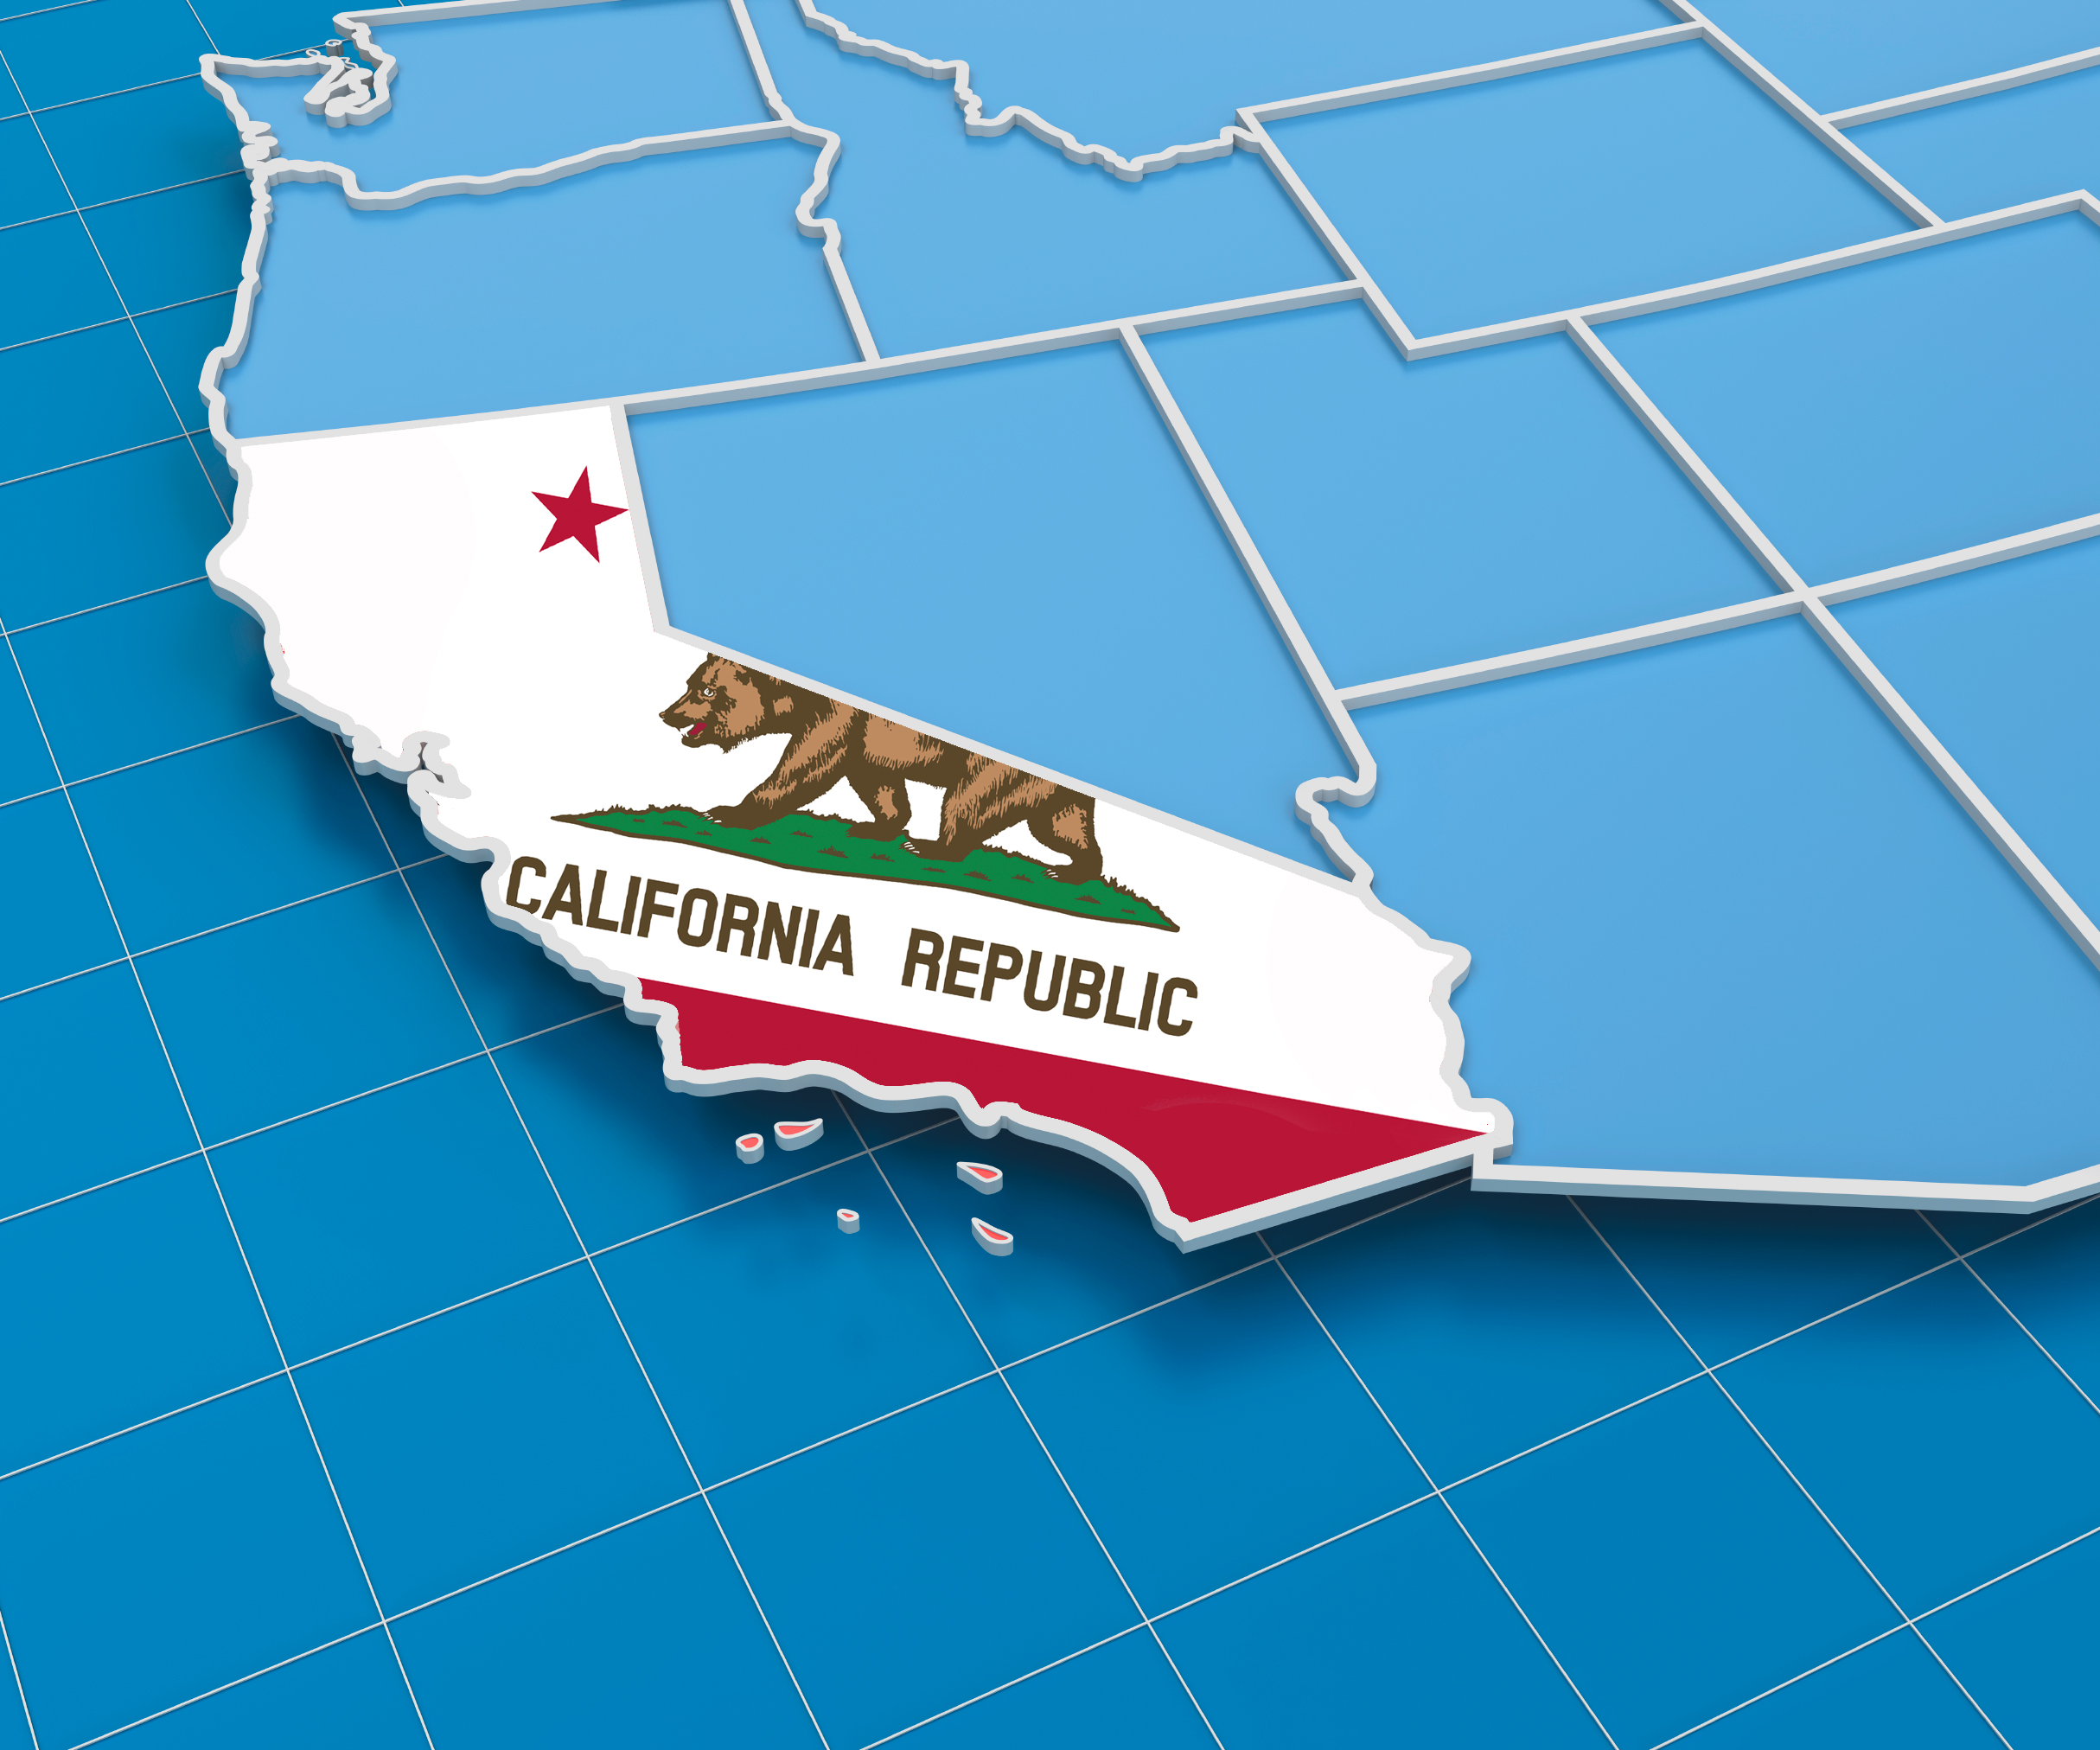
With the votes tallied, the 2016 electoral map of the Golden State once again appears to be deeply divided. The old north-south divide of earlier decades has given way to an east-west divide with narratives regularly speaking of a liberal, prosperous coast and a conservative and impoverished inland: two politically distinct “Californias.” The presidential election results confirm this view, with the coast firmly voting Democratic blue and the inland region going Republican red once again.
The outcome of the 2016 election seemingly supports these ideas of division with some powerful voting statistics. Seventy-six percent of California’s fifty-eight counties voted for one candidate over the other by ten or more percentage points; the average margin of victory across all fifty-eight counties was twenty-six points. Hillary Clinton won thirty-two primarily coastal counties, carrying an average of 62 percent of the vote; Trump won the remaining twenty-six inland counties, averaging 58 percent of the vote in them (statewide, Clinton leads, 62.1 percent to 31.8 percent). Certainly, those data make a strong case for the polarization narrative coupled with a deep geographic divide.
The New York Times presented a similar geographic claim of division in the newspaper’s postelection coverage. In this latest narrative, the Times and other California-based newspapers have argued that the Golden State is deeply divided between its urban and rural regions. The Times featured this comment from a local frustrated farmer: “There’s a huge void and disconnect here between the big cities and the country in this state; they look at us as some sort of tumbleweed in between Sacramento and Los Angeles.”
Certainly a division seems real based on the 2016 voting records of these two regions.
According to the Rural County Representatives of California, thirty-five of California’s fifty-eight counties are rural (neither urban nor suburban); Trump won nearly two-thirds of them. Of the remaining twenty-three more urban counties, Clinton won nine out of ten. Although Clinton was generally more successful in the urban areas compared to Trump in the rural regions, one candidate clearly electorally dominated the other based on measures of urbanity.
The problem with these urban-rural and the inland-coastal narratives is this: they are just wrong! The cultural and political split is simply not as pronounced or widespread as many observers and pundits would like us to believe.
To begin with, public opinion data for decades regularly revealed that attitudes toward government, abortion, economic policies, immigration, environmental regulation, lesbian and gay rights, satisfaction with the political system, and electoral behavior and political engagement are practically identical across regions of the state.
California voter registration statistics provide another powerful lens to make sense of the state’s political realities because citizens can opt out of narrow party choices.
If we look at these statistics, what becomes immediately clear is that very few of the fifty-eight counties are in fact polarized Democratic or Republican strongholds. The widely used metric for a polarized, landslide county is when 60 percent or more of the voters are registered for one party; in 2016 not one county met this standard.
In contrast, close to 60 percent of the counties met this landslide standard in the 1960s. The number has plummeted since then and has hovered around the zero mark since 2002. If we relax the standard to 55 percent for one party, five counties are partisan-leaning: the usual Bay Area suspects of Santa Cruz, San Mateo, San Francisco, Marin, and Alameda, with the Los Angeles region notably absent.
Expanding the definition to a simple majority, only eleven counties have one party with 50 percent or more of the total registration and --like the 60 percent landslide metric–the number of counties that meet the simple majority definition has deeply declined, from almost 95 percent in the 1960s to a little under 25 percent today. Those numbers and huge declines hardly suggest a state with counties that are deeply partisan and growing farther and farther apart. Indeed they are moderating.
Of course, because of redistricting, one could argue that counties are not ideal units to look at questions of partisanship. Even with California's "independent" Citizens Redistricting Commission, boundaries can and do change, with very real political consequences.
Fortunately, California’s secretary of state (the state’s chief elections officer) provides registration data by congressional district as well. Despite concerns of manipulation to create safe districts for one party or another, only four of California’s fifty-three congressional districts are landslide districts at the 60 percent level (three in Los Angeles and one in the Bay Area). At the 55 percent level, seven districts are landslides; at the 50 percent level, only thirteen are landslide counties by voter registration. Once again it is hard to argue that California districts are heading in different directions politically when only 8 percent of them had 60 percent landslide partisan majorities before the 2016 elections.
The urban-rural divide also collapses on a deeper inspection of the registration data. Looking at the thirty-five rural counties, not one county is a landslide county at the 55 percent or 60 percent level. In only two counties does one party have a majority: northeastern Modoc County, with 51 percent of the registered voters Republican, and southeastern Imperial County, where 51percent of the registered voters are Democratic. The average GOP registration in the rural counties was actually just 38 percent, compared to 35 percent for Democrats and 27 percent for independents. For a region that is supposedly a red island of conservatives surrounded by a deep blue liberal sea, the registration data show that the Republicans have only a slight lead in a fairly fractured political climate.
Turning to the urban counties, it is certainly true that these twenty-three counties lean a bit to the left, but no county has registration above 60 percent for any party and only 5 are above the 55 percent threshold. That being said, only nine of the counties have a majority. Although all nine are Democratic, the majorities are not huge. In fact, across all of the urban counties, the average Democratic registration is 46 percent, with Republicans and Independents splitting the difference at 27 percent each.
Four years ago my Hoover colleague Victor Davis Hanson surmised that there is no California in the sense that the Golden State doesn’t fit into the preconceived notion of the Midwest or Deep South. In Hanson’s words, California has a “postmodern narrow coastal corridor [that] runs from San Diego to Berkeley, where the weather is ideal, the gentrified affluent make good money, and values are green and left-wing.” The 2016 party registration, however, suggests a far more politically diverse and competitive set of urban counties.
The question for now is when will Californians demand more from their parties and when will the political elites actually listen to their constituents? The 2016 election publicized the fact that candidates on both the left and right were out of touch with the people and illustrated how fractured these partisan bases actually are.
There is a huge opportunity here for parties and candidates that actually represent these moderate ideas and listen to the people. California has long been the harbinger of social change in the United States.
Disruption is in the DNA of Californians. Although the movement to CalExit has suddenly become the cause de jure, with liberals and the press claiming that California is a liberal bastion out of step with the rest of the nation in light of the 2016 elections, the registration data do not show that Californians–regardless of how you divide the Golden State truly reflects such strong leftist sentiments. In reality Californians should embrace their centrism and help usher in a new, moderate mode of pragmatic politics.

BIG BLUE MARBLE ON A ROLL
The year 2016 marked the seventh consecutive presidential victory for a Democrat in California–the longest such streak for either major party in state history. Republican nominees won six straight times from 1968 to 1988. Vermont is considered America’s most Democratic state, according to Gallup, with Democrats enjoying a 22 percent edge in party affiliation. As of late October Democrats held a 19 percent advantage in the Golden State.
COUNTING BY THE COUNTIES
Donald Trump lost the popular vote but fared quite differently in the “paint war”: a national map that shows much more red than blue. Some 2,623 counties nationwide went Republican in the 2016 presidential election, whereas only 489 voted Democratic, including 32 very populous and coastal California counties. In 2012 the county figures were 2,420 Republican, 693 Democratic. The last time America was this divided was in 1984, when Ronald Reagan took 2,781 counties to only 334 for Walter Mondale. Then again Reagan carried forty-nine states to Trump’s thirty.
COULD TRUMP MAKE MEXICO AN OFFER IT CAN’T REFUSE?
Despite what the CalExit planners may think, California can’t simply secede from the Union. But Paul Moreno, a professor at Hillsdale College, has an alternative: retrocession. Given that the US government paid Mexico $15 million back in 1848 for the territory that became the State of California, the feds could cede it back at an equivalent 2017 price (roughly $415 million). Such a move is unlikely, for it would likely entail a treaty and a two-thirds vote in the US Senate. Then again it might pique the interest of a new president with a fondness for “the art of the deal.”


