


- Education
From 1999 to 2013, California had a standard test (STAR – Student Testing And Reporting) to assess our students on California Standards in English Language Arts, Math, the Sciences, and Social Sciences. Within its first few years, the test format stabilized, and for the rest of its life, it remained essentially unchanged -- regularly releasing a fraction of its items to educate the students and parents about the expectations from our students and offering stable longitudinally comparable scaled scores. By 2006, the California State University (CSU) had analyzed the test and decided that with a small augmentation – some dozen items each in both Math and ELA – the 11th grade test could also serve as a good college-readiness test. In this way, the Early Assessment Program (EAP), California’s High School college-readiness assessment program was born, the first in the country.
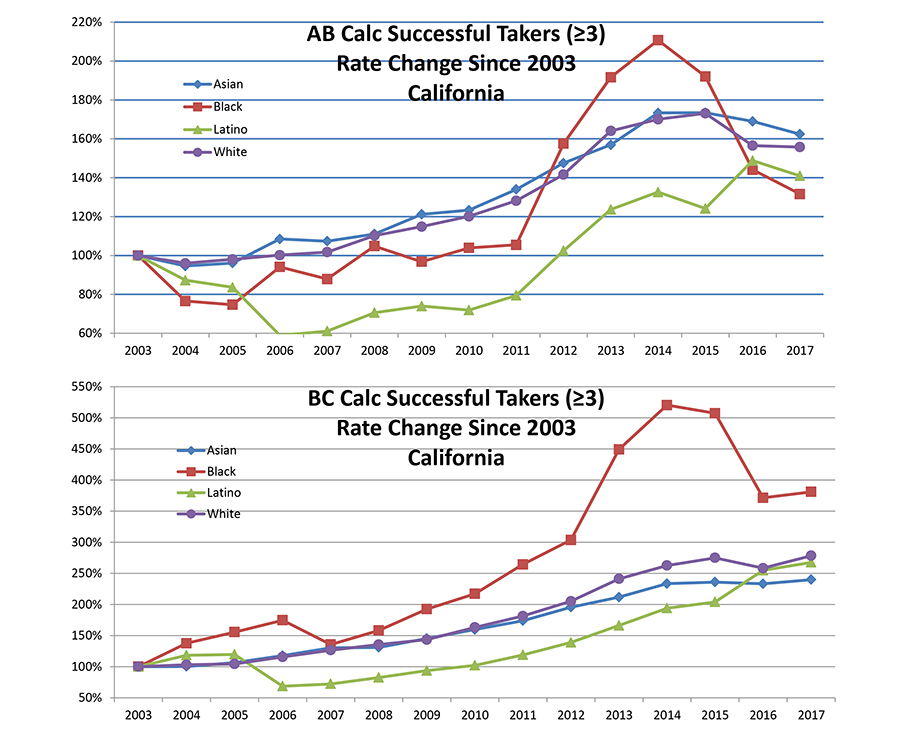
During that time California observed a steady increase in student achievement, attested not only by STAR results, but also by a sharp increase in the number of students, and, in particular, disadvantaged and minority students, successfully taking advanced math and AP courses, and qualifying for non-remedial admission to CSU. The success was also reflected in increased California ranking on the National Assessment of Education Progress (NAEP), the national test administered bi-annually by the federal government. Further, for much of its life (until 2008) the STAR test also included a short national norm-referenced test to make sure that our own test was anchored in reality and did not diverge too far from national norms -- and this norm-referenced test served as an external reference to STAR’s validity.
But things have changed since then. California adopted the Common Core standards that became active in the 2013-14 school-year, and the STAR test was discontinued. It was replaced in 2015 by a test developed by the federally sponsored Smarter Balanced Assessment Consortium (SBAC), in which California had little say as to its nature, its cut-scores, or its costs.
The first thing to note is that while STAR was administered in grades 2 through 11, with high-school mathematics being assessed based on the course taken rather than grade (e.g., Algebra 1, Algebra 2, Geometry), the SBAC test is administered only in grades 3-8 and 11, with no accommodation for testing based on courses taken. The SBAC test is significantly longer than the STAR – seven hours instead of five in elementary grades, and 8.5 hours instead of 6 in high school. And the SBAC test is at least three times as costly as the STAR test, which for almost 3.5 million tested students comes to about extra $70 million dollars every year.
But what do we know about that test itself, ignoring the extra costs, the extra testing time, and the lost information from grades 2, 9, and 10? Does it test what we want to test? Does it provide valid and meaningful results? Is the test fair and unbiased for various demographic groups? From the limited data available to the public, the results are not encouraging.
The SBAC test is aimed at assessing student achievement with respect to the Common Core standards. Yet if one looks, for example, at the SBAC math blueprint – the “map” of how many test items assess any given standard – one notes that many “content clusters” (that often include 3, 6, or even 10 standards and sub-standards each) are assessed with only 1 or 2 items. Clearly, there is no real possibility that the test assesses the whole breadths of the Common Core standards with such sparse sampling.
Further, the SBAC test is administered using a computer interface. Unfortunately, the interface is ridden with problems, and many items seem to be sloppily written. One of the more extensive documentations of SBAC’s variety of problems was done by Steve Rasmussen, and we have no idea whether any of the flaws it detected were corrected, because the consortium doesn’t retire and release any items from past administrations, so neither students nor parents can actually examine the nature of the test for themselves.
But how are our students doing on the test? California officials argue that one cannot compare the results of the old (STAR) test with the new SBAC results, because “those are different tests.” In one sense they are right – the tests are different tests, with different focal content areas and testing different skills. Yet that does not mean, for example, that we cannot check whether the new test affects equally all demographics (test for bias), or whether it is equally effective in identifying college readiness of students (external validity). Based on the data we have, it seems SBAC is not doing well.
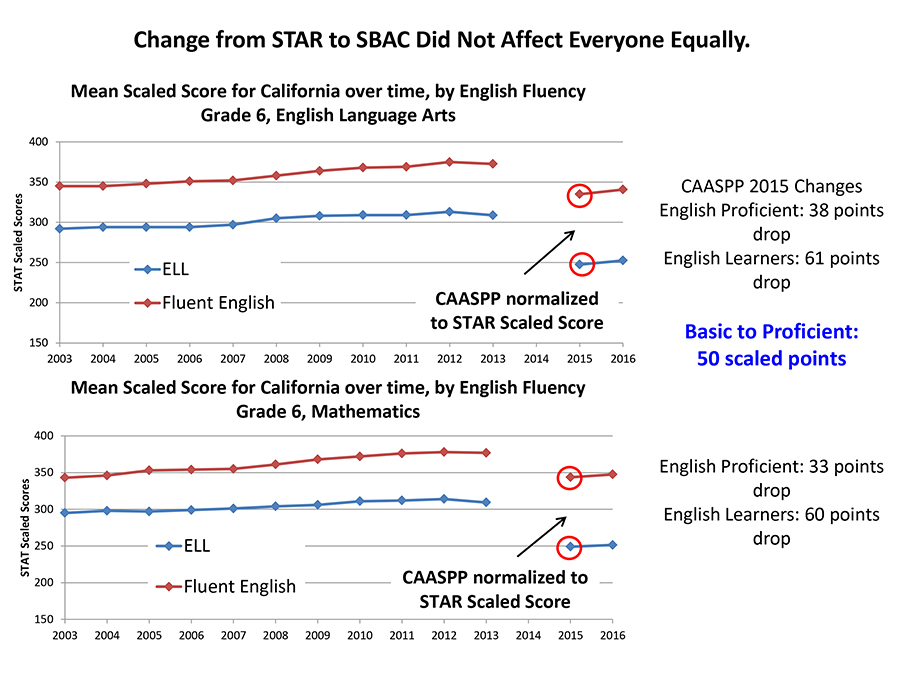
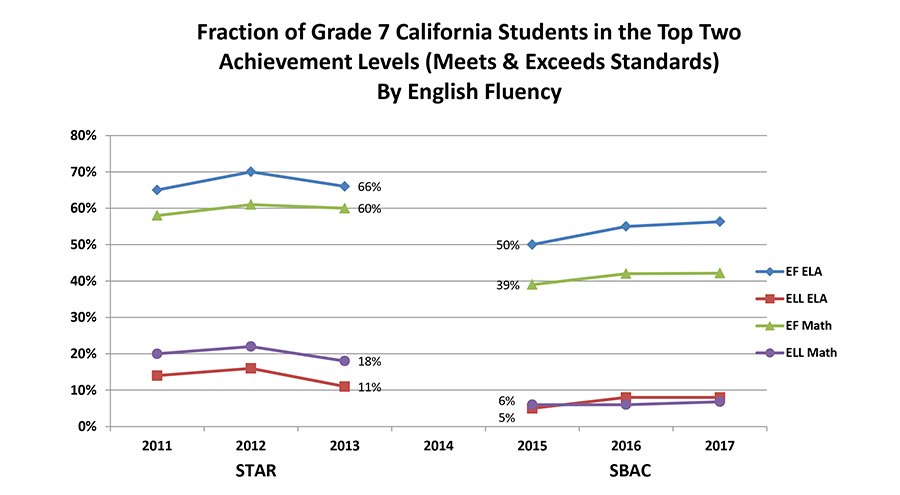
To test for bias, we can easily bring the new SBAC results onto the same “scaled scores” of the STAR test1. For example, the chart below shows the longitudinal achievement of California sixth graders in math and ELA. STAR results stop in 2013, and the SBAC results show up from 2015 and on. The fact that the SBAC results are lower on this scale is not of our concern – it can be readily explained by the different nature of the tests. But the fact that the drop of English Learners was almost double that of the English proficient is of concern. It clearly shows that the SBAC is a biased, language-heavy test that discriminates against English Learners. EL student achievement in other grades exhibit similar behavior. Another way to see it is the fraction of students rated at the top two categories (Advanced & Proficient under STAR, Meets and Exceeds Standards under SBAC). In grade seven ELA, the fraction of English-fluent students achieving those two highest levels dropped between 2013 (STAR) and 2015 (SBAC) from 66% to 50%, but the fraction of English Learners dropped by more than half, from 11% to 5%. Similarly in math, English-fluent students scoring at the top dropped from 60% to 39% but English Learners dived by two-thirds from 18% to 6%. There is little question that SBAC disproportionately disadvantages English learners.
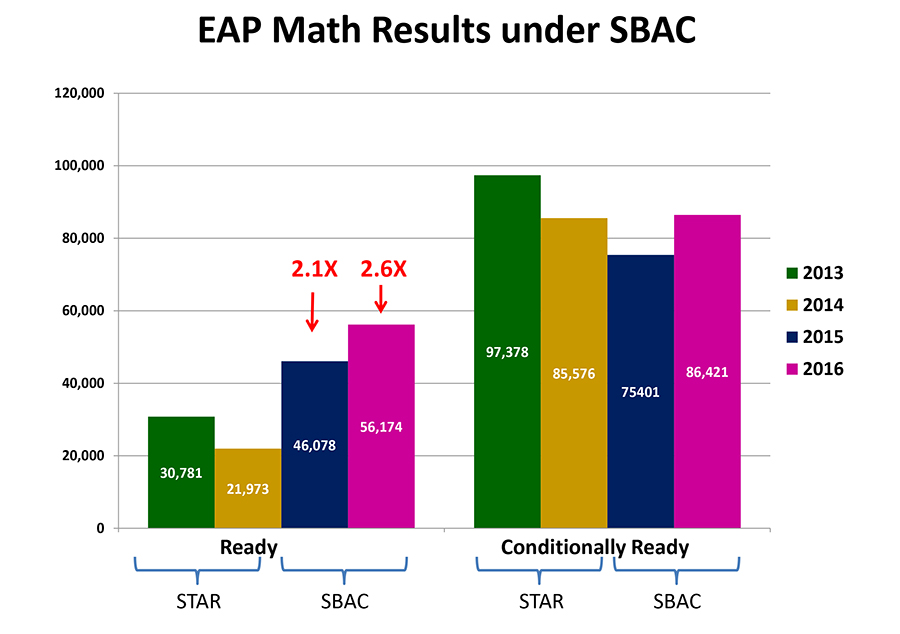
When it comes to college-readiness, SBAC did not work with college faculty to augment or verify its test’s suitability for this role. We should understand that while a summative (accountability) test such as STAR or SBAC attempts to sample the breadth of the subject matter, readiness-tests are much more focused on the fewer key understandings and skills that are considered important to be ready for the next step.2 That was the reason why CSU studied the STAR and augmented it with a dozen items focused on college-readiness. Yet this step was not done for SBAC, and state-level California education officials declared – by fiat and without any study – that the top SBAC grade 11 level represents “college readiness” while the second from the top represents “conditional college readiness,” and forced CSU and California Community Colleges (CCC) to accept such students as college-ready.
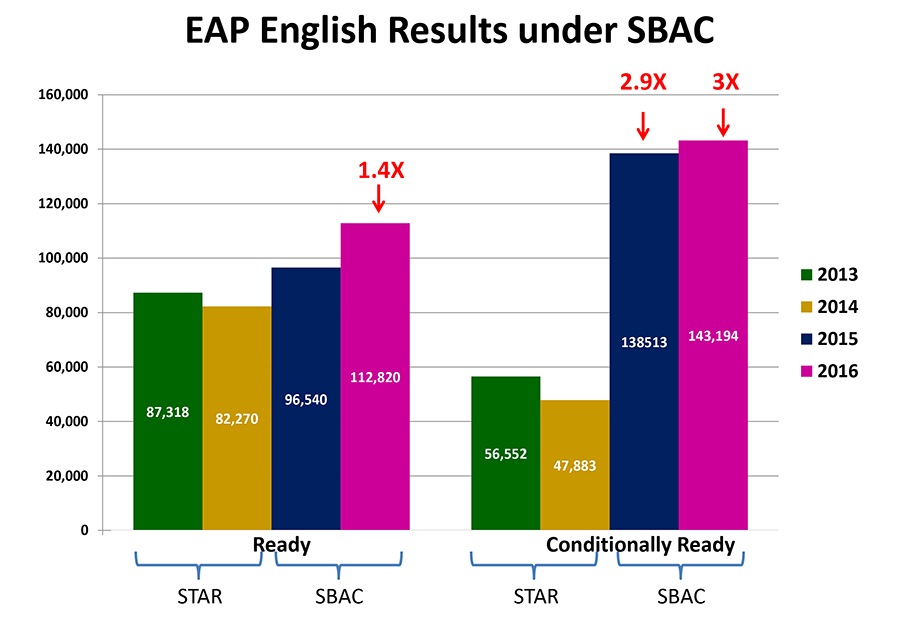
Yet an ETS study of the relationship between EAP and SBAC shows large differences between these two indicators. For example, among students who scored at the top level of SBAC in math, only 41% -- less than half – were found college-ready by the STAR-based EAP. The following two charts illustrate the number of supposedly college-ready students as determined by SBAC in comparison to EAP. It strains credibility that conditional ELA readiness tripled, and full math readiness more than doubled overnight.
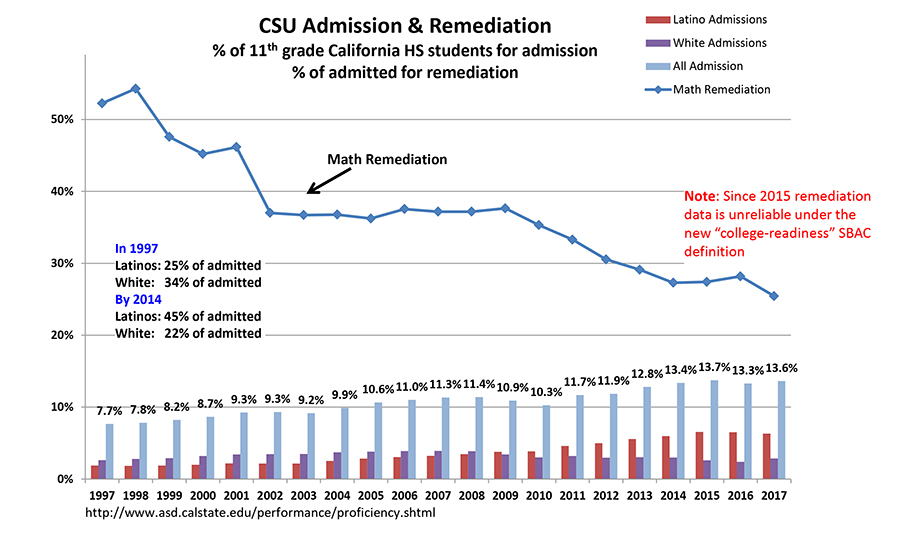
The CSU remediation rate has been steadily dropping over the years, and this drop indicates the effectiveness of the previous standards and the previous EAP measure. California decided to avoid testing the validity of its new EAP measure and instead pushed CSU to eliminate any remediation starting this year, so we will have to fly blind for longer before will be able to assess the efficacy of the new measures.
In such context the recent legislative suggestions to replace the grade 11 SBAC test by the SAT or ACT college-readiness tests makes a lot of sense. It makes even more sense, as the testing expert Doug McRae suggests, to offer our grade 11 students a menu of test options rather than a single alternative, like SBAC, SAT, ACT, and perhaps some other more vocationally-oriented tests. After all, not all of our students continue – or are even interested in continuing – to college.
Eventually, it all comes down to transparency and trust. When the state adopts a brand new test that has not been validated against external known benchmarks; when there are serious questions raised about the psychometric quality of its items and the state is unable to regularly release past items to reassure the public; when the test shows inexplicable unnatural trends and the test-maker does not address them; when test results show strong bias against populations that already have academic challenges; when a summative test is applied to psychometrically invalid purposes (college remediation needs); when the state removes our ability to track the success of our students in multiple grades under the new test; and when the state removes by fiat the ability of colleges to verify college readiness through their own testing and remedying entering students—then we clearly have a problem of trust, and we currently are flying blind.
1 Cut-scores for the old STAR and the new SBAC are readily available for each grade level, and mapping of the SBAC intervals onto the corresponding STAR scaled score is readily achieved, offering a good approximation in terms of the STAR scaled-scores.
2 For example, to be ready for college algebra, a particular attention may be given to algebraic manipulation skills, while mastering geometry or data analysis is less important.
