


A popular theory about the record-high surge of asylum seekers at the southern border of the United States is that “push factors” of increasing violence and poverty in Central America are the cause. Is this true? Has gang violence risen and poverty worsened in El Salvador, Guatemala, and Honduras?
Last week, the Wall Street Journal reported: “Illegal border crossings have been rising since last spring, prompted in part by worsening poverty, famine, and gang violence in Central America.” This common storyline can be found in nearly every news and opinion article about the crisis, followed by a handful of anecdotes. This much is true: systemic violence is rife in these “triangle” countries, particularly Honduras and Guatemala. However, this problem isn’t new. The Associated Press, for example, ran a story back in 2018 with the title “Poverty, Unemployment, Violence Drive Guatemalan emigration” over a few paragraphs that included statistics on poverty, children’s malnutrition, even unsolved crimes against women, but no mention of a trend line. The article did offer a curious side note: “Since 2015, Guatemala has seen its homicide rate drop.”
The economies of Latin America have in fact been growing steadily for decades, with notable exceptions in Venezuela under Nicolas Maduro’s dictatorship and debt-soaked Argentina. According to researchers at Andrés Bello Catholic University in Caracas, “poverty levels in Venezuela spiked during 2019, officially rendering it the poorest country in Latin America and the Caribbean.” Only 3 percent of Venezuelans, once the wealthiest people in South America, are currently food secure. That’s not normal poverty but a genuine humanitarian crisis.
When scholars look at Latin America as a whole, they find a 15 percentage point drop in the low-income population during the fifteen years from 2002 to 2017, according to a recent United Nations 2019 report. Naturally, the share of middle-income families grew, and now makes up 41 percent of the population.
This “push” theory has been circulating for years. Back in 2014, for instance, when President Obama initially called out FEMA to deal with a much smaller surge of asylum seekers and unaccompanied children, the White House published a fact sheet pointing to “systemic factors that are causing Central American citizens to undertake the dangerous journey to the United States.” Seven years ago, the crisis was novel and the root cause couldn’t be established. Now it can.
The Facts about Central America
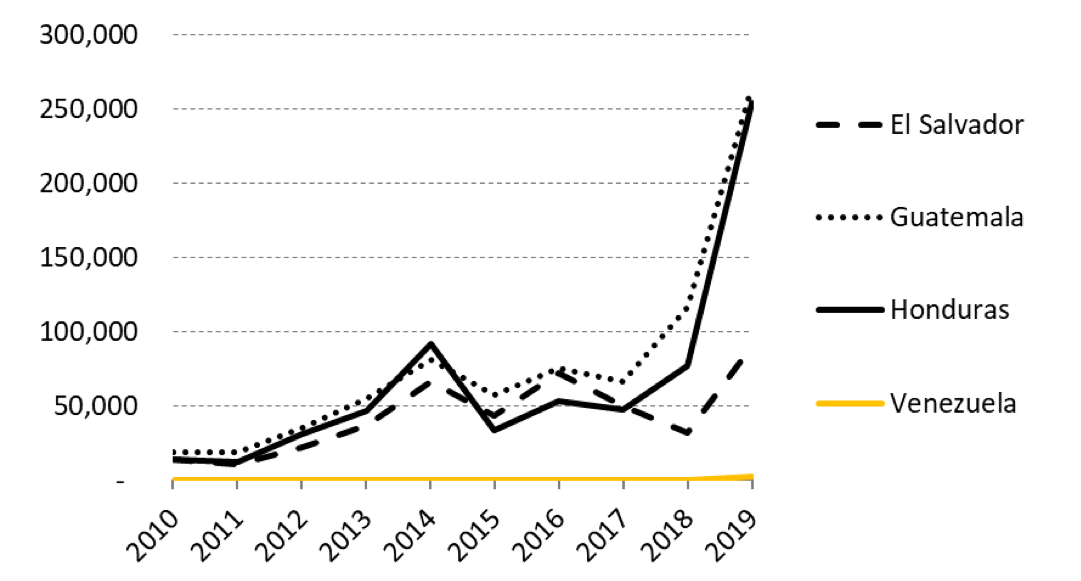
There were just over 100,000 “land border encounters” in February 2021, a record for the month, according to US Customs and Border Protection’s online stats. To really understand the scale, consider Figure 1, which uses fiscal year data by country going back to 2010. A close look reveals two things. First, the spikes in border apprehensions of citizens from El Salvador, Guatemala, and Honduras were extraordinarily high in 2019, two to four times higher than ever before. Second, the pattern over time for those three countries is tightly related. It makes no sense that all three countries experienced identical push factors in 2014, again in 2016, and again in 2019. Based on Figure 1 alone, social science would rule out any push-factor explanation, unless there is some evidence of coordinated violence or economic crises across the sovereign nations.
Two category 4 hurricanes struck Honduras late last year—the first, Hurricane Eta, on November 3, the date of Joe Biden’s presidential election victory, and the second, Hurricane Iota, two weeks later. Some say that the hurricanes, which caused nearly a hundred deaths, are a push factor, but that doesn’t square with the timing. Moreover, natural disasters on a much larger scale (Hurricane Mitch killed more than ten thousand in Honduras in 1998, a once-in-a-century event) have been addressed not through refugee policy but through foreign aid to help affected nations rebuild. And even natural disasters are short-term events that pale next to the long-term progress Central American economies have been making.
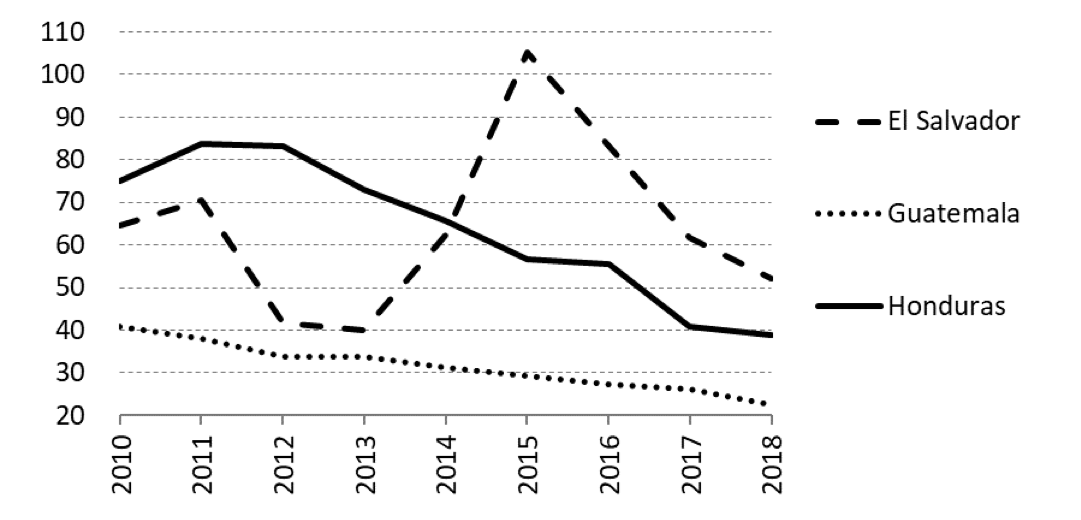
Let’s consider the facts about violence and poverty. Both have been on the decline across all nations in Central America. Figure 2 shows the best crime data available for international comparisons; this is collected by the United Nations. The homicide rate per 100,000 people peaked for Honduras a decade ago at 83.8, and has declined steadily from 2012 to the 2018 level of 38.9. Guatemala, meanwhile, was 40.7 in 2010 and has declined to 22.5. Only El Salvador had a more recent peak, but that was six years ago and has also declined by more than half.
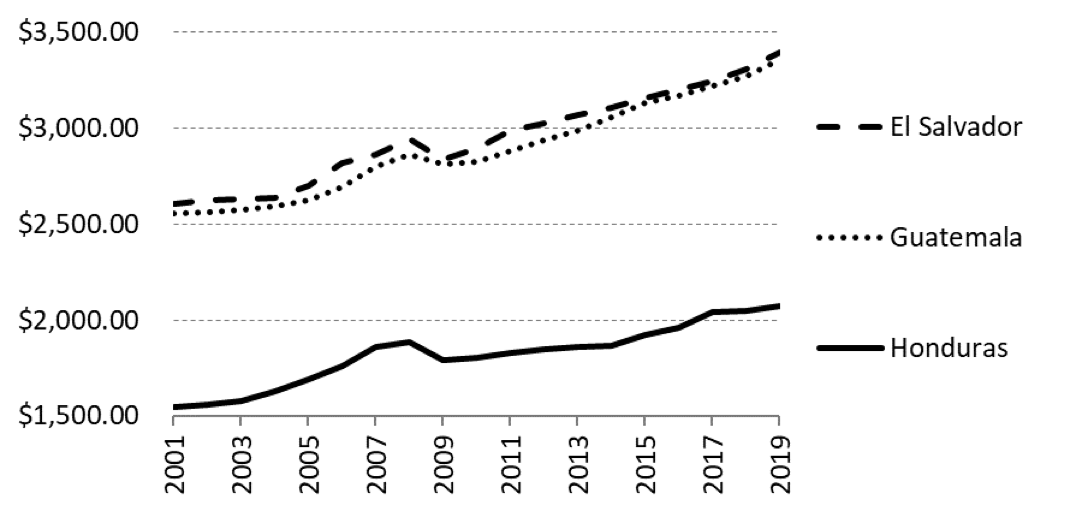
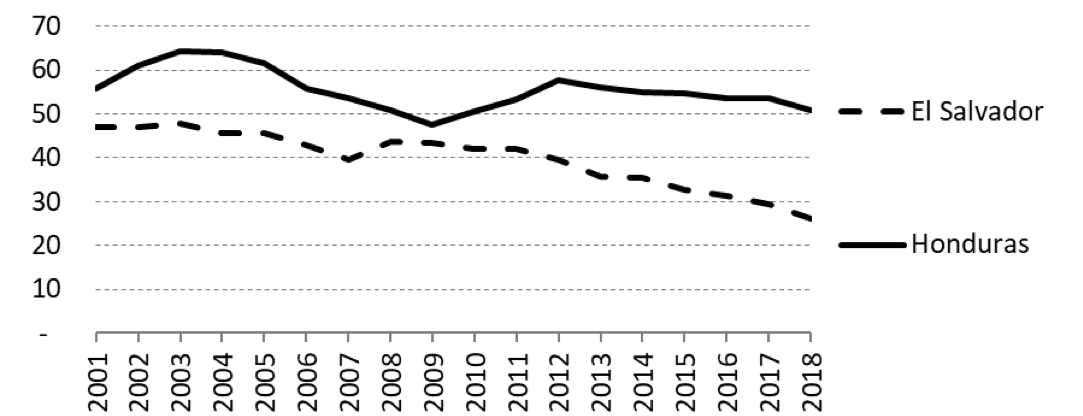
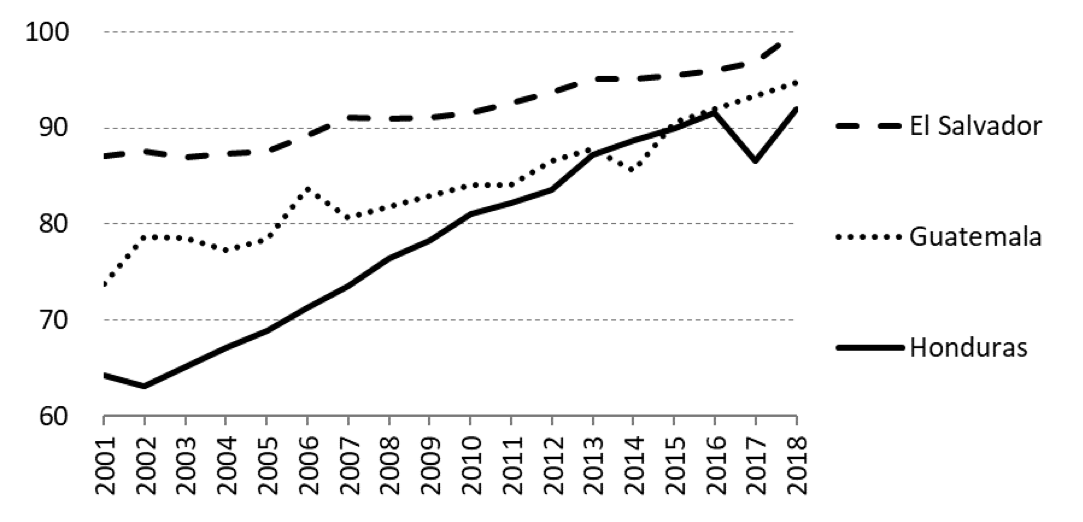
What about the economic situation? Figure 3 shows the gross national income (GNI) in the triangle countries, three of the poorer places in the hemisphere. It was the equivalent of $2,074 in 2019 Honduras, but it has grown every year—except during the worldwide great recession in 2009—from just $1,547 in 2001. In neighboring El Salvador and Guatemala, average incomes rose by even more, and both are approaching $3,500 in the most recent year. Skeptics will charge that per capita gross tallies can mask inequality, so two other data series confirm the breadth of the economic gains. Figure 4 shows the declining number of people living below the poverty threshold of $5.50 US for the only countries with data. A better measure than raw dollars is to track quality of life indicators, and for that I present access to electricity in Figure 5. The level of progress is profound.
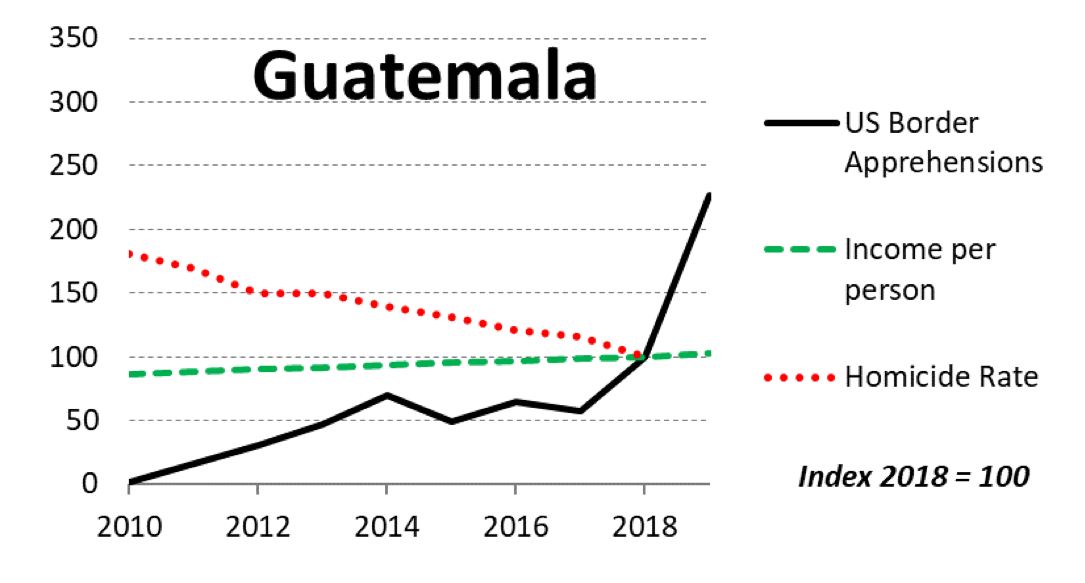
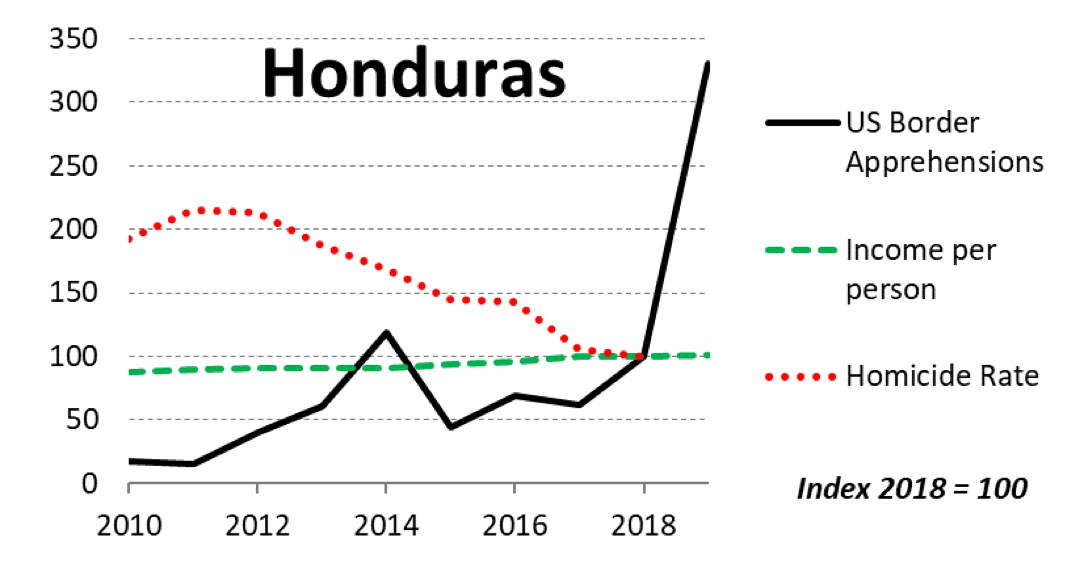
When we combine these data series, the picture provides a stark contrast to the push-factor narrative, as shown in Figures 6 and 7.
The alternative explanation for the border crisis is that “pull factors” are creating an incentive for making the 1,300-mile migration journey. The relative economic wealth and prosperity of living in the United States are a powerful draw; however, the contrast is no different today from one, two, or even five decades ago. We need to consider pull factors that might have changed in recent years. The most obvious is the change in federal and state immigration policies. Sanctuary-city laws have been adopted in many American cities, dating back to the 1980s, but have become more common in the past decade. The most dramatic pull factors are driven by federal policies, including legislation, executive actions, and court rulings. Consider the following timeline, and how key dates align with the surges of 2014, 2016, and 2019:
• June 15, 2012—President Obama signs an executive action, the Deferred Action for Childhood Arrivals program (DACA). It waives deportation for “dreamers” (individuals who were brought to the United States illegally when they were children).
• August 1, 2014—Obama announces new steps to stem the flow of Central American refugees, including activation of FEMA.
• April 6, 2018—Attorney General Jeff Sessions announces the “zero tolerance” policy for unlawful border crossing, including a new policy of separating children from families.
• June 20, 2018 (ten weeks later)—President Trump signs an executive order ending family separations at the border.
• July 5, 2018—A federal judge upholds two of California’s sanctuary laws.
Current US policy is to detain or return any adult caught unlawfully crossing the border. If claiming asylum, they are detained indefinitely until a hearing can be held. However, if the individual crosses the border with a child, then all members of the family are released inside the United States. President Obama objected to this new application of a federal judicial rule established in 1993 and 1997 (known as the Flores Settlement Agreement), but he was overruled. Before that 2015 ruling, Flores applied only to unaccompanied children, who must be released inside the United States, but the new application extends to accompanied children and their families.
The pull factors were established at key points in 2012, 2015, and 2018, each followed by surges in Central American immigration into the United States in 2014, 2016, and 2019. The US policy mix continues to create a powerful incentive for would-be entrants, and absent a change of course, it seems bound to increase unlawful immigration and asylum claims in the years ahead.
