


PARTICIPANTS
Robert Hall, John Taylor, Annelise Anderson, Christopher Ball, Karim Basta, Steven Blitz, Michael Bordo, Michael Boskin, Matthew Canzoneri, Pedro Carvalho, John Cochrane, Steven Davis, Randi Dewitty, Sami Diaf, John Duca, Christopher Erceg, Eugene Fama, Alessandra Fogli, Jared Franz, Oliver Giesecke, Tyler Goodspeeed, Rick Hanushek, Robert Hetzel, Laurie Hodrick, Robert Hodrick, Ken Judd, Matthew Kahn, Greg Kaldor, Tim Kane, Pete Klenow, Roman Kräussl, Anne Krueger, Marianna Kudlyak, Jeff Lacker, David Laidler, Oliver Landmann, Stephen Leroy, Ross Levine, Mickey Levy, John Lipsky, Michael McKee, Roger Mertz, Ilian Mihov, Rich Miller, Athanasios Orphanides, Radek Paluszinski, David Papell, Fabrizio Perri, Randal Quarles, Valerie Ramey, Paola Sapienza, Lawrence Schembri, John Smyth, Richard Sousa, Tom Stephenson, Derek Tang, Jack Tatom, James Van Horne, Kevin Warsh
ISSUES DISCUSSED
Robert Hall, the Robert and Carole McNeil (joint) Senior Fellow at the Hoover Institution and Professor of Economics at Stanford University, discussed “The Active Role of the Natural Rate of Unemployment,” a paper with Marianna Kudlyak (Federal Reserve Bank of San Francisco).
John Taylor, the Mary and Robert Raymond Professor of Economics at Stanford University and the George P. Shultz Senior Fellow in Economics at the Hoover Institution, was the moderator.
PAPER SUMMARY
We propose that the natural rate of unemployment may have an active role in the business cycle, in contrast to a widespread view that the rate is fairly smooth and at most only weakly cyclical. We demonstrate that the tendency to treat the natural rate as near-constant would explain the surprisingly low slope of the Phillips curve. We observe that evidence is weak about this basic point—the evidence neither comes close to rejecting the conventional view nor does it reject a very different view in which fluctuations in the natural rate are associated with a substantial fraction of cyclical volatility. We show that the natural rate may have closely tracked the actual rate during the long recovery that began in 2009 and ended in 2019. We explain how the common finding of research in the Phillips-curve framework of low—often extremely low—response of inflation to unemployment could be the result of fairly close tracking of the natural rate and the actual rate in recoveries. Our interpretation of the data contrasts to that of many Phillips-curve studies, that conclude that inflation has little relation to unemployment. But we also call attention to a recently growing body of research along New Keynesian lines that supports the credibility of the hypothesis of a strong relation between movements of the natural rate and actual rate of unemployment.
To read the paper, click here
To read the slides, click here
WATCH THE SEMINAR
Topic: “The Active Role of the Natural Rate of Unemployment”
Start Time: February 21, 2024, 12:00 PM PT


>> Speaker 1: We're very happy to have our colleague Bob Hall speak today, jointly with some work with Marianna Kudlyak. I don't know if she's here. She's coming?
>> Bob Hall: She may come.
>> Speaker 1: But she may come.
>> Bob Hall: It'll be on Zoom.
>> Speaker 1: That's all we'll look for up there. The title is the active role of the natural rate of unemployment.
I can't think of a better title.
>> Bob Hall: Really?
>> Speaker 1: Go for it, Bob, entertain us.
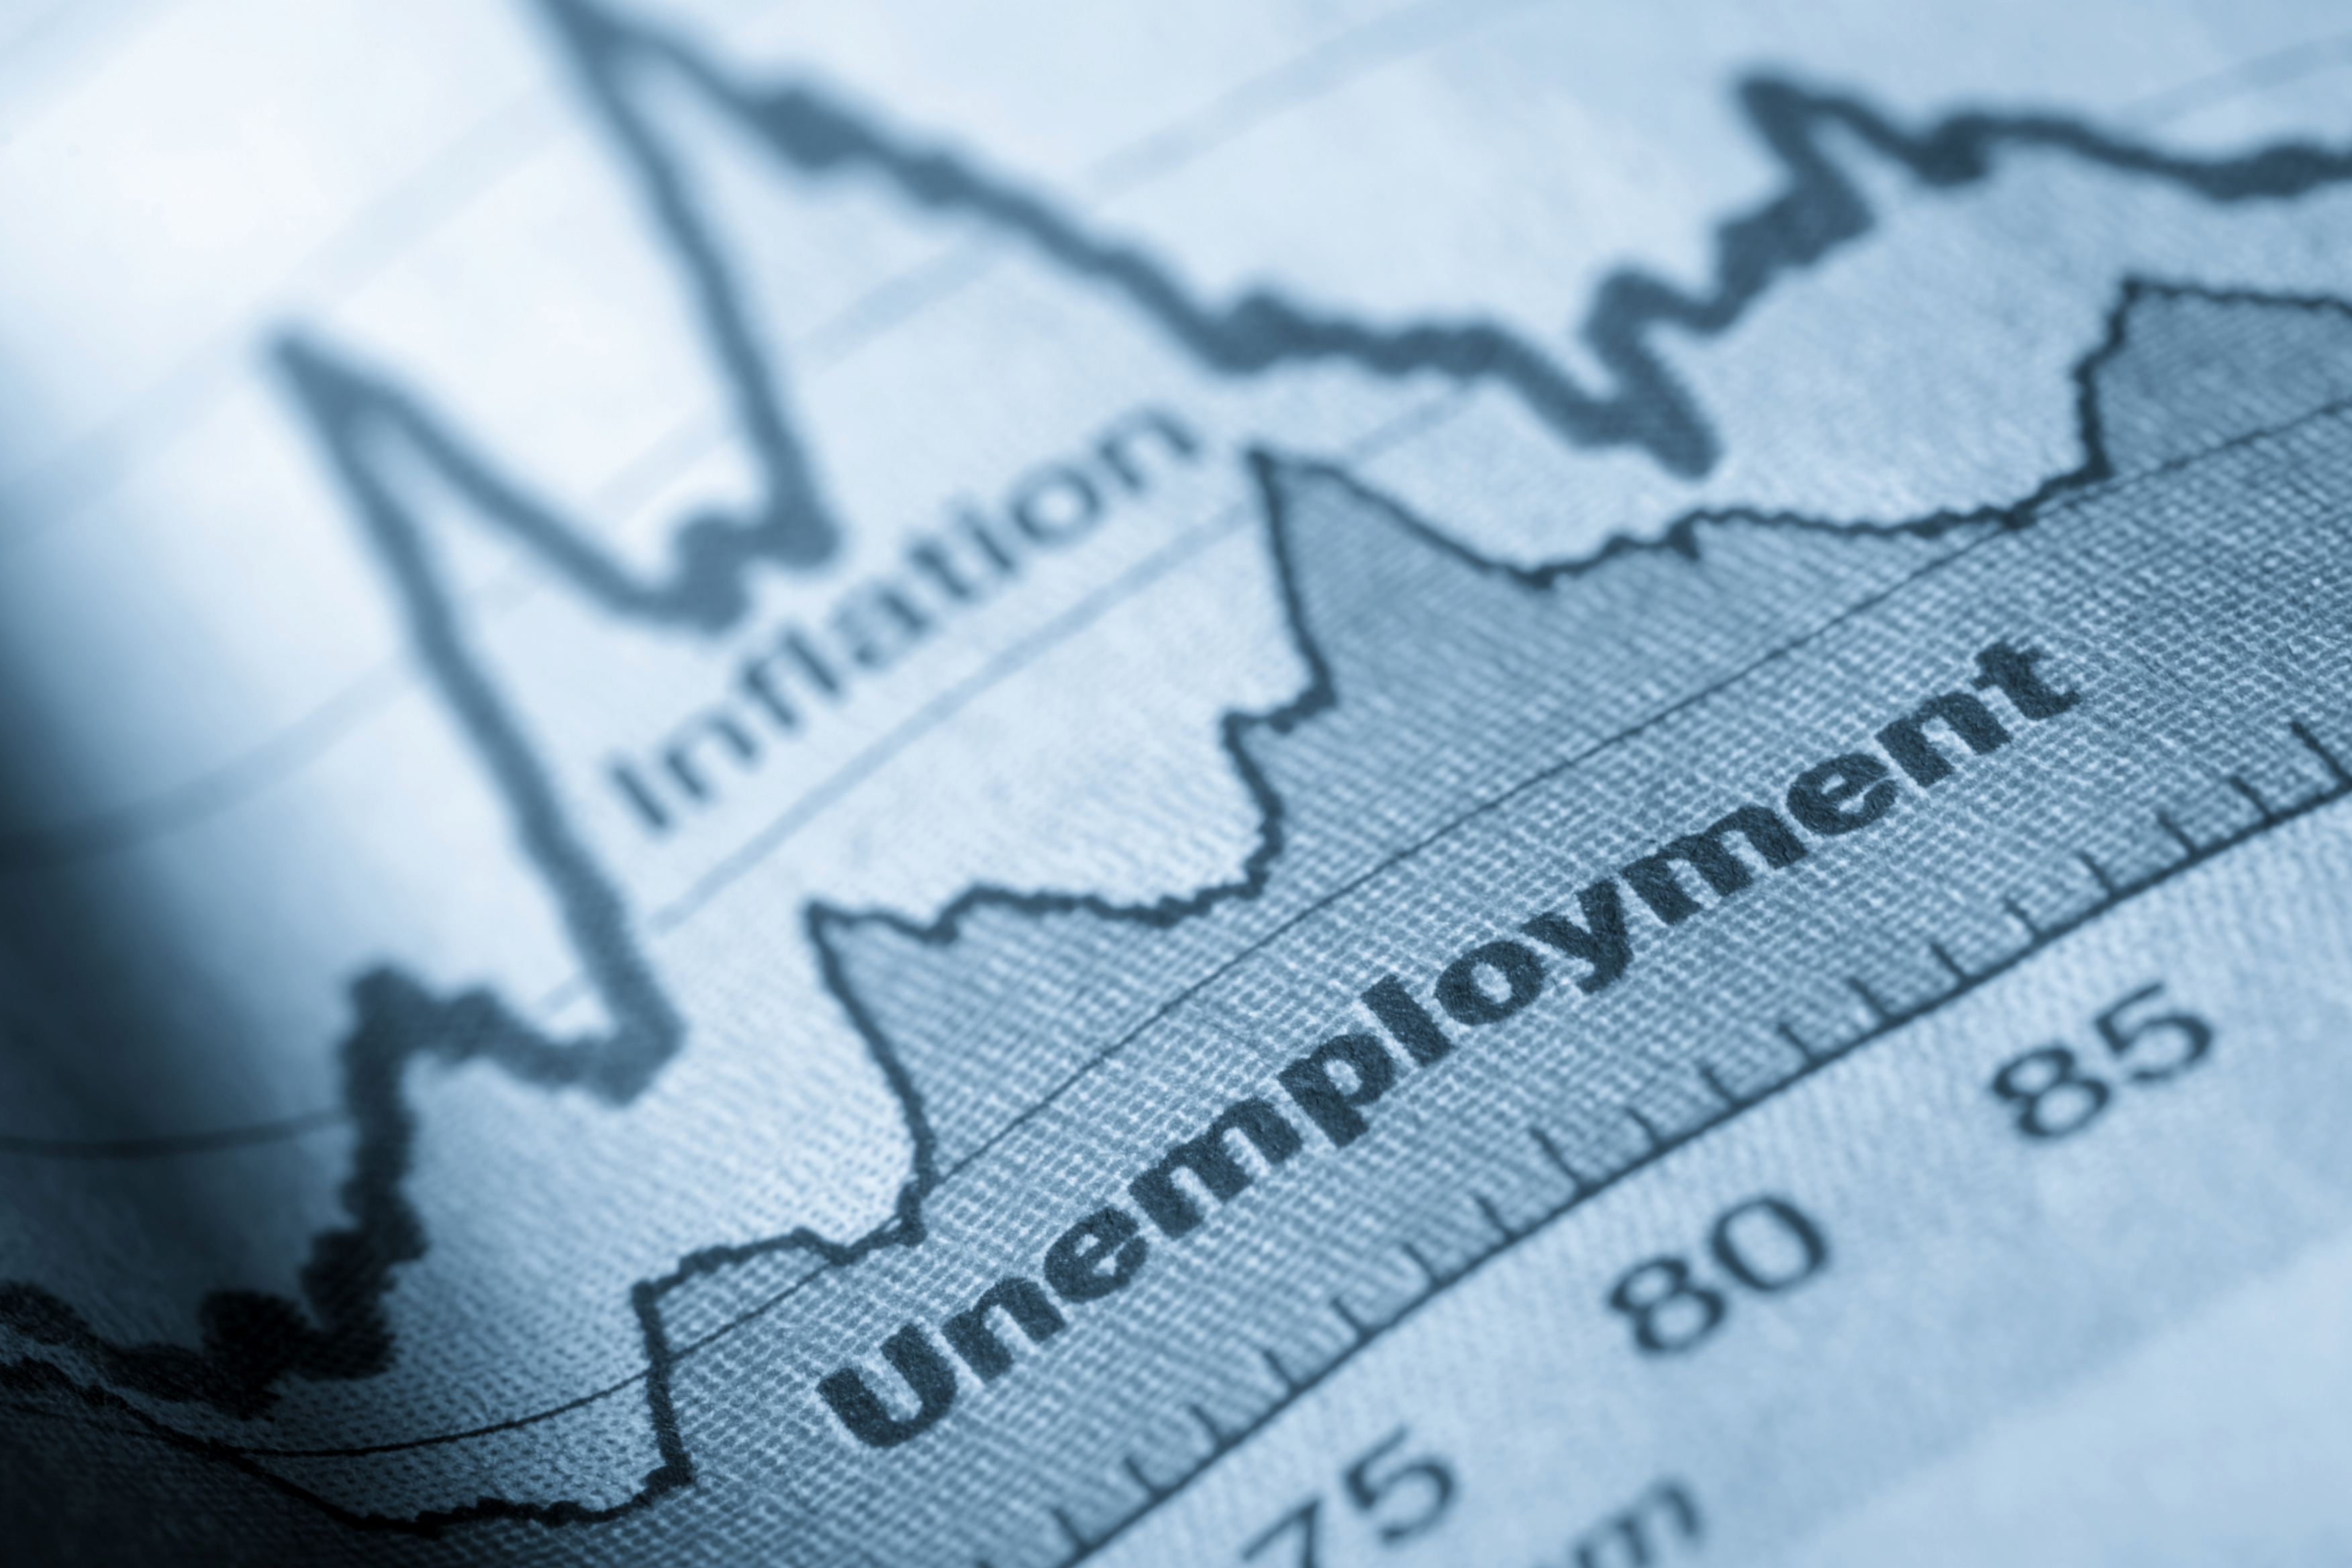
>> Bob Hall: Okay, so Marianna and I have been pushing a line of research for about the last four years. I just mentioned it briefly, this one picture is kind of the starting point of it.
And what this demonstrates, and this is from a published paper, it shows that recoveries measured by unemployment are all the same. Particularly, they are all pretty close to the same slope, especially starting after 1960, and most spectacularly in the long expansion that went from 2009 to 2019, which is a record length for recovery or expansion.
And they're all essentially straight lines. And that's got to mean something. So much so that we wrote other papers on that subject, and a few, these are all available from Mariana's website, but they're all puzzling and taking advantage of in different ways, two of them. First of all, the first one it just explains, basically jumps off, explains that diagram and its significance and statistical tests of just how unique it is.
Then we were invited to do a macro annual paper based on that, which at some length tries to think through some of the underlying economics. And then finally, as time went by, more things happened. And so the third one, the unemployed with and without jobs, refers specifically to what happened in the labor market, by this measure, during the pandemic.
Okay, so that just gives you a sense of what we've been doing. What I'm going to talk about today is all new, except that you'll see that the idea of partitioning the data into recoveries and the opposite of recovery is a recession. We've done very little on recessions and mined the data for recoveries.
And that's not an aspect, although there's a huge literature, especially on the topic today, the natural rate of unemployment. Partitioning the data in this way has a pretty small literature, so we've been pushing hard on that. Okay, so off we go. Okay, so we considered the New Keynesian model, in particular, the Phillips curve.
The basic ideas here are all in Dalton Friedman's presidential address. So literature from that is absolutely gigantic. Almost everything New Keynesian was laid out verbally, initially. And also something that's gotten less attention is that the JPE asked him to write down his ideas more formally in the issue that came out in 1970, but that looks very familiar today.
But those ideas really all date very discontinuously from Friedman's presidential address. Okay, so this is, since this literature is very extensive, and we've read a lot of it, we can't claim to have read absolutely all of it. I think almost all the important papers, especially focusing on the natural rate, have gone into our procedure, and we tried to figure out what's going on.
One aspect of it is that an awful lot of the literature is regressing the rate of inflation in the form recommended by Friedman. I'll get into the details of that shortly. Progressing, a measure of inflation on the unemployment rate. And we argue that that's not an identified way to learn anything about the Phillips curve.
It's essentially the same point that you make all the time. People regress y on an x and say, okay, now I learn how x affects y, or as a causal relationship, but that's not identified. Why aren't you regressing? X on y is the starting point, at least in persuading the orthogonality condition that lies behind a regression requires, has to be true.
And if you do not do it at all, you're doing non identified econometrics, which is of course, rampant everywhere in statistical work, but particularly, I think, in trying to estimate a Phillips curve.
>> Valerie: So, yeah, I mean, here it's even more specific that the key regressor is not measured.
I mean, it isn't something you can see in the data. So you actually have to come up with an estimate of that and then also the slope. So that's.
>> Bob Hall: Okay, so, yeah, that's the first point we'll make.
>> Valerie: Yeah.
>> Bob Hall: it's clear you need is some measure of the unemployment rate that is measured relative to something, namely the object that we're talking about here, the natural rate of unemployment.
So you've jumped. Good.
>> Valerie: But my point, when you were just talking about the standard Y on X, X on Y, at least you can talk about sort of an unconditional correlation. But you can't do that with the gap because you don't directly measure the gap. So it's an even worse problem.
>> Bob Hall: Yeah, okay, all right. So, most of this paper is about how to get around that, and a lot of it is evaluating other people's research. But then there's one contribution, and it was this one contribution which came out of our research on recoveries and is quite striking.
Another thing with ten recoveries, spread across the page, showing a great deal of common behavior. All right, so standard analysis of what can go wrong in a regression in ordinary least squares, all the defects are a big help because in the literature, the slope of the Phillips curve.
Now when I say slope, the Phillips curve we're talking about a slope downward, because it uses unemployment, Philips curve would slope upward if you use it, some other measure of activity. But since unemployment is negatively affected so, whenever I talk about the slope declining, I mean it's not as negative as it used to be.
But bear with me, if it's confusing, we worked very hard on trying to DE confuse that topic, but humans are just not well equipped to deal with negative numbers.
>> Speaker 4: You could say flatter or steeper.
>> Bob Hall: Pardon me?
>> Speaker 4: You could say flatter or steeper.
>> Bob Hall: Yes we do, yes that's one of, yeah.
Of course, maybe it should be the other way around, who knows?
>> Speaker 4: That's right.
>> Bob Hall: Yeah-
>> Speaker 4: No cause and effect here.
>> Bob Hall: Yeah, but many Phillips curves that were reliably negative when they were run, just using recent data, turn out to be completely fine. We'll overcome that problem with the Phillips curve that's well identified, over this period, so I think we're making some progress.
>> Bob Hall: Okay, so we're gonna introduce a new hitherto ignored opportunity, taking advantage primarily of the conditions of that it existed from 2000 in the long recovery after the great recession. Okay, so why are we really interested in this? Why do we care about the slope of the Phillips curve?
It's everything that separates one camp of macro. Which I at least kind of believe in, which is at least under some conditions, the economy can be described effectively in a real business cycle framework. So, we're only as opposed to the impression that you get from modern work and new Keynesian framework, where the Phillips curve is turned out to be flat.
And people are taking that seriously, so we're doing what I've always regarded as the French style of macroeconomics, which is to assume that all prices are fixed. And that's because that's become effectively a framework and I don't believe in it. I especially don't believe in it based on the experience of the last two years.
When we've had a very large swing upwards and inflation followed by an equal swing down, with very little, excuse me, very small changes in the unemployment rate.
>> Speaker 5: I was gonna say, Pete cleanup and Mark Phillips have a lot of work showing how there's a lot of flexibility in prices.
I think most people would argue the stickiness would be more on the wage side, and I mean Act two can be debated I guess, but just FYI.
>> Bob Hall: Yeah okay, fair enough. Yeah, we've concentrated on the price level rather than wages, but you're right that the new Keynesian approach has been applied to both prices and wages.
Okay so, we would like to make progress, but the progress that we've made is not overwhelming. Cuz it turns out that, first of all, our new idea for achieving identification really only works for this long period. It works beautifully, for 2009 to 2019, but for reasons I'll explain when we get there, that same trick, or I shouldn't say trick.
But device is not, it requires the smoothness of what we emphasize so much in that period, which on the price side, there's much more fluctuations and we'll see that. But I think we're making some progress, we can think through what the flat Phillips curve people, what it takes to believe that.
And it's not completely incredible and it's not completely something that we can dispose of econometrically. But the sort of general idea that this research pushes, is that we should at least sometimes take price flexibility more seriously than it appears to be in most of this most recent literature.
Except there's a branch of literature, which of course we love, which comes out more our way, but that literature has not really been absorbed in the mainstream. All right so, let's do a little bit of math, I think this is, Well known to anyone who calls herself a macroeconomist, but otherwise gives a little foundation.
That's pretty easy. So we're looking at the Phillips curve. The left hand side of the Phillips curve is measure of inflation. But as Friedman emphasized, it's gotta be the deviation of inflation from some base. It can't be just the total rate of inflation. And we call it the inflation anchor.
And a lot of that's a term that's entered this literature in the last decade or so, especially during the time, again this long super decade in which inflation was extremely stable and near the fed's declared target of 2%. And that term of anchoring. And it's a good term.
So it's the term we use, although we emphasize that, we're not trying to say that it's anything different from what's also identified as the base level. The star level is expectations. A lot of people think, though, that there's something illegitimately circular about causing the right hand variable, a variable that's the conditional expectation of the left hand variable.
And putting on the right hand side that is fundamentally distrusted, even though it's correct. We have no critique of that. We know the math, but it's kinda an odd way to put it. So when we talk about it, we call it the inflation anchor. But it has the same role as Friedman clearly identified in his presidential address.
Okay, so that's the left hand variable. This paper is not about the left hand variable. There's a big literature about the left hand variable. We cite the literature, but we're saying, okay, fine, let's assume that we've got the right specification and it fits this concept of providing a base.
And also comment on how the left hand variable is derived from the type of underlying theory of occasional updating of prices in line with what's recently happened and the amount of delay. And that's what the right hand, the specification on the right hand side then takes. So it's the interaction between the left hand side and the right hand side is what we want here, which is phi, the slope of the Phillips curve on the right hand side.
Again, we want a base level, which is kind of the main topic. We're gonna accept standard ideas about the left hand side. Everything new in this paper is about the right hand side. And so U star is this concept that is well understood in the literature, but very often not fully developed.
In fact, the literature on the right hand side, the natural rate side, is generally not as fully developed as the literature on the left hand side. So we're trying to contribute to making up for that issue. Okay, so we have this. So the specification on the right hand side is minus.
So phi can be positive because it's got a minus sign in front of it. So that's our solution to the problem of. You can tell me if you think that's the best.
>> Valerie: Well, I think that's great.
>> Bob Hall: Pardon?
>> Valerie: I think that's great.
>> Speaker 4: Which sides of things, where you put things on the equal side, obviously, it doesn't matter mathematically?
But your last line does sort of suggest interesting causal interpretation which is sorta the fed's way of looking at it. We create more unemployment. That pushes down inflation. Of course, Lucas thought it was higher inflation that caused the output gap to change. In reality, it's an equilibrium condition without causal interpretation.
>> Bob Hall: Correct, okay? Good, I don't need to say that.
>> Speaker 4: Complaining a little of effect on your next line.
>> Bob Hall: Okay, well, all right, point taken.
>> Valerie: Well, that can be one of the equations.
>> Speaker 4: Yeah.
>> Speaker 4: Is this meant to be the equilibrium condition or one of the equations in an equilibrium system?
>> Bob Hall: I'm not sure I get.
>> Speaker 4: I'm just repeating John's point.
>> Valerie: Yeah.
>> Speaker 1: You can imagine some models say that surprise inflation causes unemployment to deviate from the natural rate. Some models say that deviations of the actual unemployment rate from the natural rate cause inflation to deviate from the anchor.
So, should I think of this as an equilibrium condition that combines both of those? Or is this just one equation that just captures, I guess, the second of the two causal effect?
>> Speaker 4: Even those models until you put it in general equilibrium. Remember, Lucas asset pricing model is that consumption causes asset prices or asset prices causes consumption.
>> Speaker 1: You need more than two equations.
>> Speaker 4: Yeah.
>> Speaker 4: The basic point I'm still trying to understand, should I think of this as an equilibrium relationship, or is it just one equation in a system? And this particular equation captures the causal effect of unemployment deviations from the natural rate on inflation.
>> Bob Hall: So, in the paper, we didn't. The slides don't actually pursue that issue. But in the paper, we definitely take. It's an equilibrium condition. And, but, when you talk about the underlying mechanisms, then it comes dangerously close to taking a stand on cause and effect.
>> Speaker 4: Well, there can be a cause and effect.
That's fine even within an equilibrium system. If you, I'm just telling you, we already know this. If you can isolate, yeah, you can get some exogenous variation in the right hand side. And I think of this as one equation in a larger system, then I can estimate phi.
Is that the enterprise here or not?
>> Bob Hall: In effect, yes.
>> Speaker 4: Okay.
>> Bob Hall: You'll see, it's more primitive you're talking of it. Anyway, you'll see.
>> Bob Hall: Okay, so that's an object that's we're gonna be dealing with for the rest of the talk. Okay, so just to say a little bit about this question that Steve was just discussing without taking a firm stand, we just describe the situation as we understand it which firm, for one reason or another, only visits the question of setting a price episodically.
In most of the literature, the frequency of that is fixed, although there's a big new literature which emphasizes the fact that when things get going, and interesting, like there's a big shock that one of the things that happens is the prices get reset faster. And we, toward the end of the paper, we discussed that specifically okay, so that's coming out the anchor is an object that is shaped by monetary policy.
And if monetary policy is successful in stabilizing the price level at a known target rate, which it was in that period, the long recovery, that is an analytical role. And as I say, there's a number of papers that, I discovered these papers, by writing a paper myself, which was fairly primitive, but then I immediately started getting emails from people saying, you missed my paper.
So right now I'm leaning on that, but we'll come back to that if we do get to the end, which I don't promise.
>> Speaker 5: The increased supply of journals has led to an increased supply of papers relative to history I think it's a common phenomenon, Bob.
>> Bob Hall: Okay, well I don't think it's a waste I think it's real progress in this area somehow it's still just.
>> Speaker 5: I'm not saying it is, I just think it's harder to keep track of everything simultaneously.
>> Bob Hall: Yes, okay. Well, we're looking at the overall behavior of something which, and this is just an attempt to pass on the flavor of the underlying thinking from Friedman on. Okay, so the last bullet here that I wanna emphasize is that there's an information environment that people setting prices think about.
If the world looks like it's gonna be pretty quiescent over the relevant period, then we only need to rethink prices every year or two when exciting things are going on. As the entirely unexpected burst of inflation starting in 2021 emphasizes an excellent example of then it looks to me like one thing that happened is that the price setters said, no, the world has changed dramatically.
Now we need to reset prices quickly and the frequency of resetting prices wasn't a big factor in the price adjustment literature until this current round of papers, which obviously is motivated by this major change. Okay, so that lies in the background and I'll come back, okay, so then the idea of this, Friedman's idea was that an indicator of where the economy stood in terms of output measured by unemployment.
Well, through the kind of process that I was discussing about price setting would capture the inertia and prices, if p is a small parameter, then prices are highly inertial. All right, so I think we've covered that I just remind you that there's a couple of slides which just repeat through, just so you'll get it.
We can flip that over this goes back to that discussion we had a few minutes ago about whether there was any direction is there an arrow of causation here? And the answer is no you can turn it around, put unemployment on the left hand side and inflation on the right hand side, and that's called the aggregate supply way of looking at the world.
And it's just long division there's nothing else because these are equilibrium conditions, as Steve was talking about. That's important because Friedman made the point, which I think to some extent has been forgotten, or at least in our work, it's very emphasized and here you can see it. And that is that if i is equal to pi star, it's sort of the economy's gotten pricing right, then u will be equal to u star.
That's just a logical, persuasive equilibrium condition that sort of tells you what, tells you what ut is okay, so what happens if it is equal to pi star t what's the value of ut? Ut is equal to u star or flip it around if you wanna know what u star is, it's just equal to ut.
And Friedman was quite emphatic on that but the econometrics hasn't paid much attention to it. We propose if we can figure out whether pi t is equal to pi t or not, is inflation at the level that is characterized by star, the kind of the base level of inflation.
Nothing special is happening to inflation, then nothing special is happening to unemployment and, well, you can just read it unemployment then. So u star, the natural rate of unemployment, is just the observed level of unemployment and that's just set pi t equal to pI. It doesn't matter what phi is then that's it's the glory of it you don't need to know phi, but of course, it also means that you can't use your knowledge of phi to adjust, so you can only do this when that's the reason the phi is irrelevant as long as it's not zero, and we'll come back to that.
But obviously there's a major problem with this argument of if et is zero or near zero, and we have to put some noise into the process, which we will do later to make that point clear.
>> Speaker 4: Bob, so when we, once you say the word econometric, people commonly put additional shocks in the top one.
>> Bob Hall: Sure.
>> Speaker 4: Marginal cost shocks and supply shocks and greed shocks and all the rest of it.
>> Speaker 4: But do you wanna fold those into the PI star on you, or are we coming to additional shocks and thinking about what they're orthogonal to or not?
>> Bob Hall: There's just a brief discussion of that in the paper, it doesn't.
So if you put other things in the Phillips curve, which of course, if Phi is not part of the story, so we'll go back to Phillips Curve, then you need other variables to explain why inflation is changing. And then there's a big literature on things like markups of supply chain, economics has given the life too.
And that's all you can just add, put a plus and whatever things like that you want as part of the Phillips curve.
>> Speaker 4: Well, sometimes yes, sometimes no. I mean, either way it usually runs through is that the marginal cost is in the end proportional to the labor supply.
So maybe there shouldn't be additional shocks, or maybe it's a nanostar, I'm just curious how. Okay, so we'll get-
>> Bob Hall: We're not taking a stand on the absence of supply chain effects.
>> Speaker 4: But just econometrically, when we start talking about identification, are we gonna think about that having additional errors in it, or is that the equation?
I guess that matters because if you just say Pi minus Pi star is my definition of U star, then whether there's other shocks or not as a measure.
>> Bob Hall: Sure, yeah, yeah, yeah, you can speak up.
>> Speaker 4: Okay, I will hold my piece then.
>> Bob Hall: When I show you the magic diagram, which is coming up soon, then you can raise that issue, which is quite relevant.
All right, so I recovered all this. B has this very central role in macro, so there is an appropriately large literature on it. Okay, so now we observe that two of the Phillips curves variables are observable. That's unemployment and overall inflation. But the natural unemployment rate, the inflation anchor and the slope of the Phillips curve are theoretical constructs that are objects that are become available.
Through theory in a kind of a standard model building way, but we don't have data for them.
>> Valerie: Now, if you think of PI star as expectations, you can at least have some kind of measure of expectations, say, professional forecast. Unlike Ustar, where we really don't have something that at least is a direct measure.
What has a little bit more with PI star than u star?
>> Bob Hall: Yeah, okay, obviously, it doesn't matter for us because we're not.
>> Valerie: I mean, I'll have to see. But one thing people have found is when you put direct measures of expectations into a lot of these models that are estimated, things can really change.
>> Bob Hall: Yes, okay. Yeah, whatever is. Okay, so we would just bow in the direction of best practice. One thing that, one body of data that is just tremendously overlooked is the Cleveland Fed's digestive swap, relevant swaps. But nobody ever, and that's where I would go if I were pursuing this.
But anyway, all right, so we need to say something about how the theory develops and becomes econometrics because of this lack of data on them. As you said, Valerie, the one that this paper is about is the natural unemployment rate, and there's no body of data that we're aware of where you can just pull it out the way you can.
As you said, for expectations. Given time, I'll just say that this is just a custom version of the standard argument that you need orthogonality. You need to know what's going on with a disturbance and a regression, or you can't claim that you've learned anything from running a regression.
Even though that is violated over and over and over, especially in more casual work.
>> Speaker 6: So, Bob, up until this point, you've had a sub t on your fee, and now you're estimating a common coefficient. Do you think that the slope of the Phillips curve is moving over time in most models or most economies?
And why did you sub t it?
>> Bob Hall: Okay.
>> Speaker 6: And not now?
>> Bob Hall: Well, I guess, having written a paper myself on changes over time, I believe that especially recently, I think the slope of the Phillips curve became much deeper in 2021 than line.
>> Speaker 4: Or maybe just, there was no Phillips curve to start with, and we wander around a little.
>> Speaker 4: We start in 2020, we go like that, and then 2021, we go like that, and, the slope came steeper. Well, maybe it's just the galaxy anyway.
>> Bob Hall: But what you're seeing here is there's misidentification of the slope of an equilibrium relationship.
>> Speaker 1: Yeah. Well, there has to be that.
There has to be some equilibrium relationship. And you're claiming here that if I miss, or in the extreme case, I don't allow for Ut star variation at all, that's what you've got here. So this is not about misidentifying a causal relationship, this is about misidentifying an equilibrium relationship as you've got it here.
>> Bob Hall: Okay.
>> Speaker 1: You could also just put cove T and vt there and keep Bob happy. Covariance and conditional variance. Little subscripts on both sides. But your point here is a little different than the usual one about misidentifying a causal equation.
>> Bob Hall: Give me time to think about that.
Yeah, I guess there should be covariance. And I see the sub t is not present for fees.
>> Speaker 1: That's another point, that's a different point. It's a distinct point from the one I'm trying to make.
>> Bob Hall: Yeah, right, but I'm just thinking.
>> Speaker 1: We usually think about the fees as moving slowly through time, Lucas inflation, the international evidence paper, right?
So I think even Bob wants it to be slowly moving. It's different in the pandemic.
>> Bob Hall: Yeah, I mean. That's gonna be sample specific on what amount of time you choose to do the estimation.
>> Speaker 1: That's fine.
>> Valerie: But he's making the point that feed changed abruptly a couple of years ago.
>> Speaker 1: Or maybe it didn't.
>> Valerie: No, I know, but it's not the slow moving, common filter, time varying parameter model.
>> Bob Hall: Okay.
>> Speaker 4: The flat Phillips curve makes no sense whatsoever. If you look at this cloud and say, well, there's nothing there, we'll call it flat, because a flat Phillips curve means if I raise inflation ten basis points, I can cure unemployment forever.
Well, that's ridiculous.
>> Bob Hall: Okay, but of course I agree with you. Now, you've adopted the causal interpretation in your last statement.
>> Speaker 4: I know that's the way everybody at the Fed talks to me about it. Well, at least sometimes they want unemployment to cause inflation. Sometimes they want inflation to cause unemployment.
Whatever's convenient for the policy at hand. I'm sorry for the outburst, which is unrelated to anything you have to say. We get the point.
>> Bob Hall: Yeah, okay, so we need to be more specific about what arrangement of the data means that some things have a time subscript and others don't state it as an assumption.
Okay, so this capital C just measures the bias and the estimator that arises from the fact that the right hand variable, which is just the regular observed unemployment rate is correlated with the U star. Which is behaving, whose role, because it's not in there, is that of an omitted variable, and c is the omitted variable bias that's induced that way.
As we know basic econometrics, that bias could be zero or needs to be known. I guess the relationship, the excluded variable relationship is just this phi hat, which is the estimator, the biased estimator, which under most conditions appear to me that it's going to. So the notation invites you to conclude that the bias will be downward so that we argue that excluded variable downward bias is a likely cause of the decline in measures of fee that's occurred in the general literature on this.
There is sort of a Phillips curved slope emergency and slopes started coming back essentially zero and we argue that that's perfectly possible from the fact that they didn't pay any attention to identification. And you need a solution that thinks seriously about identification and not just make the self serving assumption.
For example, that their correlation is zero and there is no excluded variable bias. Okay, so the idea is to achieve identification by taking seriously this idea that at least in some cases, there's an identified. This further condition that if PI is equal to PI star, so the zero part, all that part of the Phillips curve zeros out, then you should observe the observed U is equal.
All right, so you can't dodge this. The burden is absolutely upon you if you're running ordinary least squares or any other estimator, that it satisfies the relevant identification conditions. Okay, so we're going to pursue that. And now we're gonna read Friedman and interpret his remarks in this form, which I showed you before, and then say, we know we've inferred that PI was equal to PI star from that long recovery from 2009 to 2019.
And so we can just tell you, we can give you a whole long monthly log of what the natural rate was because we know this condition and now unemployment. So that's the idea. I believe that it's totally novel, but anyone knows? Not done a lot of work on the literature.
Okay, so when inflation equals the anchored rate, the actual unemployment rate equals the natural rate of unemployment.
>> Speaker 1: So, Bob, here's where your antagonist would bring up shocks.
>> Bob Hall: Okay, you already did before.
>> Speaker 1: Some later slide, okay.
>> Bob Hall: Yeah.
>> Speaker 4: So the minus, not plus, right, and Pi minus Pi star?
>> Speaker 1: It takes an international economist to notice the signs are wrong.
>> Valerie: I know.
>> Speaker 1: The rest of us, P star. You're just inverting.
>> Valerie: Exactly, appreciation, depreciation, the ratio.
>> Speaker 1: So it's a minus sign instead of a plus sign on the PI minus PI star. Is this saying the sign's wrong?
But I guess, no, it's u minus u star. Okay, I see, I'm wrong.
>> Bob Hall: It is correct or it isn't correct?
>> Speaker 1: It's correct.
>> Bob Hall: Good, okay.
>> Speaker 1: Cuz it's u star on the left hand side, not.
>> Bob Hall: It's surprisingly hard to get the signs right.
>> Valerie: This is good cuz you're always-
>> Speaker 1: Sorry about that.
>> Bob Hall: Okay, so here we go. And this notion that the one thing that breaks down is the fact that phi is in the denominator of that expression. And if phi is 0, we're out of luck. Now that I forget whether there's a slide for this, but we do demonstrate or observe that this is not a yes no question because there's other random determinants in the equation as John's been suggesting.
So that's in the paper. Anyway, it's in the paper, read the paper. Okay, so this is the do, this is it. This is the payload for this paper. Every month that in which the rate of inflation was in a very narrowband around 2% by this logic is a month when you can read the natural rate out of the actual rate, and well, it happens all the time.
Anyone who's been paying attention to the numbers knows that this condition has been true in spite of the fact that during that time, unemployment has declined from almost 10% or exactly 10%, 10.0 down to 3.5. But it turns out that that was all essentially what you get out of this, except for the gaps.
>> Speaker 1: But don't they rescue this? The standard line is that b is a very, very small number, the Phillips curve is very flat. Inflation is a little bit mismeasured, so theres lots and lots of slack. That's standard line, right?
>> Bob Hall: Yeah.
>> Speaker 1: Or there was marginal cost shocks or something of the sort.
I don't believe anything, I think you're right.
>> Bob Hall: I think when we write up our conclusions, we cover that point, but I think you're right. We don't say, this wins. It's unambiguously the case that this argument is incorrect, and you describe exactly the conditions.
>> Speaker 1: A strained set of assumptions that needs strain.
>> Bob Hall: No, the strain one would be, as you were arguing, I think that it can't really be zero. It doesn't go through that easily.
>> Speaker 7: I mean, in a way we summarize it in the data over this period, we see very, very different employment and inflation doesn't move.
See, either unemployment is equal to the potential, the time potential moves unemployment or the fee is incredibly flat. And you say I'm leaning toward the first hypothesis-
>> Speaker 1: Or this whole equation is junk, or this whole equation is junk.
>> Speaker 7: I don't know, maybe. I mean I think it's a way of saying is, the end is the RPC model.
All unemployment is natural, it's like it's driven by some shocks. And maybe there is some connection but it doesn't show up in this-
>> Speaker 1: Better way of saying, yeah, or the RBC model reigns and there is no-
>> Speaker 7: That's how I see it.
>> Speaker 4: We're all just agreeing with you in many louder forms.
>> Valerie: So, through Okun's law, there's an interesting implication for potential GDP relative to what the CBO thought it was. Are you gonna show a graph for that? Good.
>> Bob Hall: Yeah, graphs coming up.
>> Speaker 4: Well, except potential GDP is a different concept than non-inflationary GDP, right? Potential GDP is sort of if everybody found a job tomorrow, what we could do.
>> Valerie: No, not the CBO.
>> Speaker 1: Not in the CBO.
>> Speaker 4: They think of it as non-inflationary GDP. Okay, cool. Valerie and I are advisors of the CBO on this. And you've just taught me something.
>> Valerie: We talk about this constant before.
>> Speaker 4: To be clear.
>> Bob Hall: I showed this at the last CBO meeting near there, right?
I showed this, but I didn't have enough time to-
>> Valerie: Actually, do you also have a graph of that during the 90s, which also had some interesting aspects?
>> Bob Hall: Yeah, okay? So okay, what have people done? An awful lot of Phillips curve regressions have committed the conspicuous crime of putting only the unemployment on the right-hand side, which is equivalent to saying that the natural rate is a constant.
Well, if it's a constant, then its chance of satisfying the orthogonality condition is zero. So it's not make a lot of sense. And that's the problem with so much casual econometrics of failing to recognize that you got to take the orthogonality condition or whatever it is seriously. Okay, so what we call approach one is either saying that the natural rate is just a constant, in which case, it drops out of the progression, or it's something that's smooth and has low amplitude and high smoothness.
So that takes us. Let's see. Yeah, okay. So here's CBO. So, tension CBO advisor.
>> Speaker 7: If you use this approach, then the estimate of it is unbiased, right, because the new star doesn't move.
>> Bob Hall: So I don't know. You're not allowed. Wait, wait, wait, that's not the ground rules.
The ground rules are always that you don't know what u star is. You don't get to pick u star, u star is something that should be aware of the fact that it's got substantial fluctuations.
>> Speaker 4: But your bias calculation presumed knowing something about u star. And if u star is fixed, then there is no bias.
And we estimate phi equals zero, because unemployment goes up and down, inflation goes nowhere.
>> Bob Hall: That's what I'm saying.
>> Speaker 4: And we estimate it correctly-
>> Bob Hall: Right, correctly.
>> Speaker 4: In that case.
>> Bob Hall: In that case. No, I guess the way we put it in the paper is that you're at risk for getting a highly biased measure.
If the natural unemployment rate has substantial volatility. Okay, so here's what's going on, so what are we looking for here? If you believe in your heart of hearts, just as I was saying before, that it has to be not just volatile, but it has to be volatile and positively correlated with the actual unemployment.
What we're considering here is the possibility that unemployment has two components, one not correlated with the cycle, and that's gonna be the natural rate and the rest of it correlated. And we want to observe that, and this diagram shows if you believe that what the CBO has done, which is an extreme example of low volatility and low frequency.
Then if the natural rate actually looks more like the blue, then you're gonna get a huge downward bias. All right, so, and it's astonishing how many studies have simply accepted what the CBO does, but without any commentary on what the dangers of calling out the natural, right? There's also a more recent literature, but now a pretty substantial literature that, in which there's some kind of statistical model which contemplates volatility, arguably.
At least, has taken some precautions to allow so a specification that allows the disturbance which the natural unemployment rate, interpreted as the natural unemployment rate. Allows that to be positively correlated with total unemployment. And, well, it turns out that.
>> Bob Hall: So I would, the paper by Bok et al, which is a brand new paper on this topic, has a very good citation to this literature, which is mostly pretty recent, as you can see, and their typical findings.
Okay, this is from that same literature. See, now we'll be flipping just to the other side, where the natural rate is turning out to be tracking the unemployment closely.
>> Speaker 4: This all depends on what restrictions you put in to identify natural.
>> Bob Hall: Yeah, okay, well.
>> Speaker 4: The CBO said the natural rates gotta be a two-sided moving average of the actual, it's gonna be real slow.
And these guys looks like they put in, it's a random walk, so it's gonna be real fast.
>> Bob Hall: Yes, okay.
>> Speaker 4: Some should be in-
>> Bob Hall: What we haven't done, which is really difficult, is to evaluate the specification. We know from its results that it's capable of tracking, it's capable of doing what the CBO specification can't do.
There's no way the CBO approach is ever gonna take a form other than a very slow movement.
>> Valerie: Cuz this is based on demographics.
>> Bob Hall: Right, so this is a more open-ended or open-minded.
>> Speaker 4: Or more degrees of freedom in Phillips curves, if we needed more, that's my interpretation.
There's an identifying assumption here somehow, which has gotta be the time series process, the natural rate. Another would be to take your work on search, this is matching seriously, and, and say, the natural rate. This literature has some of that flavor, so it's more than just specifying some.
Maybe some of these papers just specify a stochastic process for the natural rate with some parameters to estimate, but at least the ones I know of in this literature are more sophisticated than that. Not that they're more convincing, I don't find them convincing, but they are trying to take into account the frictions in labor market search and match.
>> Bob Hall: Yes, exactly.
>> Speaker 4: Yes.
>> Bob Hall: Yes.
>> Speaker 4: But it just means in some sense, more complicated models, more degrees of freedom in trying to make it all fit together.
>> Bob Hall: Yes, okay.
>> Speaker 4: Which I.
>> Bob Hall: That's the way-
>> Speaker 4: This literature is already overrun with degrees of freedom.
>> Bob Hall: Yeah, but, okay.
>> Speaker 4: I'm not criticizing what you're doing, I'm just saying this whole enterprise is extraordinarily challenging and it's not clear that it's one on which we're ever gonna make much progress.
>> Bob Hall: Okay, well, I think the only progress we would claim is the diagram that I showed you before.
>> Speaker 4: Pi star, so u equals u star, that's it, right?
>> Bob Hall: Yeah, we only have five, bob, five minutes left. Okay, well, we've done pretty well, I think. Okay, then there's a, what is it? And by the way, just stationary state. Well, the idea of integrating DMP is in.
Okay, so the approach three is to use a general equilibrium model which understands the economics and will permit running a counterfactual in which you suppress some source of noise. So you're characterizing whatever it is you think the natural rate. So the natural rate is the counterfactual unemployment rate in a model that understands unemployment in a way that separates it from some of it coming from business cycle sources and some coming from other sources.
And well, so this, a paper by Gali and co-authors, Smets and Wouters, and a more recent version of it does that quite nicely and has, I think, plausible results. But again, it seems hard, hard to, all these methods, all these methods that look superior in their technique tend to come to results in which the natural rate almost steals almost all the volatility.
We haven't come up with something that's kind of sufficient, reasonable in between, either, like ours goes all the way, literally all the way, or most of the way. These more sophisticated things I just talked about, or you do something naive and gives the natural rate nothing. There's no way to get the natural rate to be half the story, it either grabs the whole story or none of the story, well, that's okay.
We've covered this.
>> Bob Hall: Okay, so these are just wrap up, we're pretty much on schedule. So is the sticky view, which is pretty much right now, the kind of macro that the fed consumes, let's say, is very stuck on the notion that there's nothing to supply and demand.
Supply and demand doesn't help you understand macro at all, because when you put a price in called fee, kind of a basic price, it just doesn't do its job. So it's what I call French macro and, okay, so that's one way to go.
>> Speaker 4: So sticky prices and sticky inflation are two very different things, something that I've only realized.
>> Bob Hall: Okay, now we cover that.
>> Speaker 4: Do you mean sticky inflation here or sticky prices?
>> Bob Hall: Okay, the paper stakes out a position that with discrete time, there's no distinction. Now, I've just heard you lecture on this very topic, right?
>> Speaker 4: Yes, that's why I finally am aware that there's a huge difference of the two things.
>> Bob Hall: Yes, in.
>> Speaker 4: In discrete time, even, is there momentum to inflation is another way of putting it, or is there momentum to prices? And those are two very so even in discrete time models, standard new keynesian models have no inflation momentum. The Fed seems to believe in a lot of inflation momentum that 747 is come and done.
We gotta have a smooth landing.
>> Speaker 1: Bob, you have to sum up.
>> Speaker 4: I'm sorry, and I have to.
>> Speaker 1: You got two minutes left, take you two minutes, take your two minutes and ignore that.
>> Bob Hall: The question is, can I cover all these things?
>> Bob Hall: So the pandemic, can I have a picture for the pandemic?
Okay, well, I think the main thing, the way the pandemic gets in here is that it was the source of just a huge amount of expansion of uncertainty, and arguably, as a first order effect, making fee larger.
>> Speaker 5: Relative price changes make be larger, I get the pain, that's a good point.
>> Bob Hall: All right, so that's it.
>> Speaker 4: It seems to me there's a conceptual loose end that still is bugging me, the identification challenge that you presented is about identifying the equilibrium relationship between inflation deviation concept and the unemployment deviation concept. This other literature you're referring to, I think at least some of that literature, isn't claiming to identify the equilibrium relationship.
They're trying to identify a causal interpretation from one inflation surprises affect unemployment or unemployment deviations from the natural rate affect inflation. So you still haven't, and even in your language here at the end, you're kind of moving back and forth between these two interpretations. So I think you need to decide which one you're about maybe you're about both, but then you gotta be clear when you're moving back and forth between.
>> Bob Hall: Okay.
>> Speaker 4: I'm still a bit uncertain as to exactly what the claims are in that respect.
>> Speaker 1: There's one more question for them from the board up there is that Bosca? Can't see.
>> Speaker 5: Yeah, hey, Bob, it's just kind of a, it's both a conceptual and empirical question.
You drew these lines apparently from the peak of unemployment down. But unemployment typically had peak after recessions ended early in recoveries. Now maybe that's due to the legacy of how Victor Zarner was wanting us to measure recessions and recoveries, but do you have a stance on that or you're kind of admitting that it's the same thing as the efficient frontier.
We'll curve that starts up for a bit before it starts down, does that affect anything is that just you? I know you've long believed that employment should dominate in the estimation of timing.
>> Bob Hall: Well, my hands are tied a little bit in answering that, I can't describe what my recession dating committee does, that's against its rules.
But, I think it's okay to say that I disagree, I support what the committee does but I disagree with their inadequate attention to unemployment, we've had that argument over.
>> Speaker 5: You've made this argument to me over the years, including whether you should use a filtered rate control and all that sort of stuff.
I think your work in general has moved me toward your position also.
>> Speaker 1: Thanks.