


- Economics
CLICK HERE TO DOWNLOAD THE .PDF
Housing boom-bust cycle during 2000-2006
- house prices and price/rent ratios increase by almost 50%
- household debt/GDP takes a discrete step up
- homeownership rate increases from 65% to almost 70%
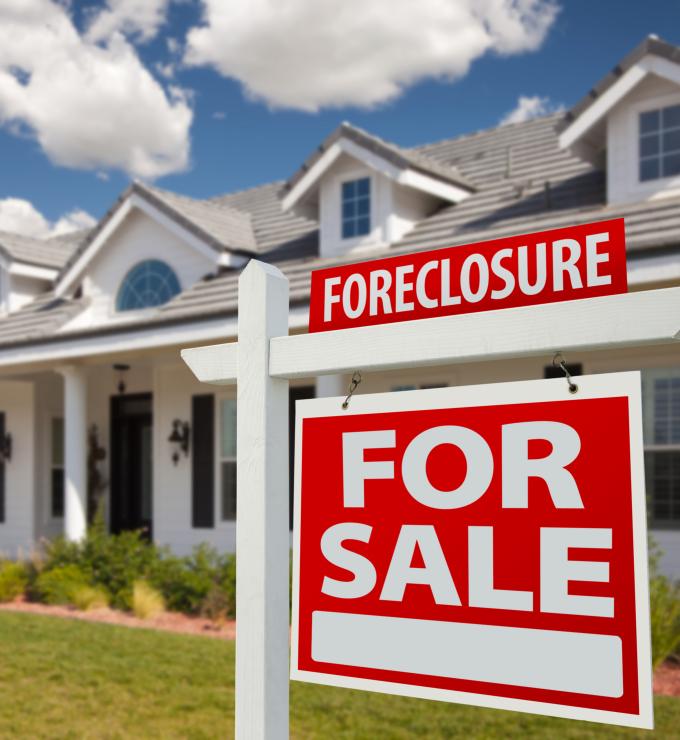
Housing boom-bust cycle during 2007-2011, these trends get reversed
- house prices and price/rent ratios fall
- households reduce their debt, in part through default
- homeownership rate below 64%
