


- Economics
- Law & Policy
- Regulation & Property Rights
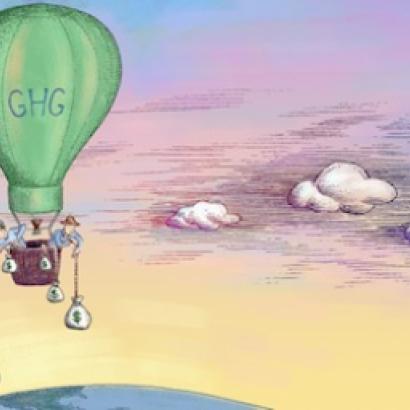
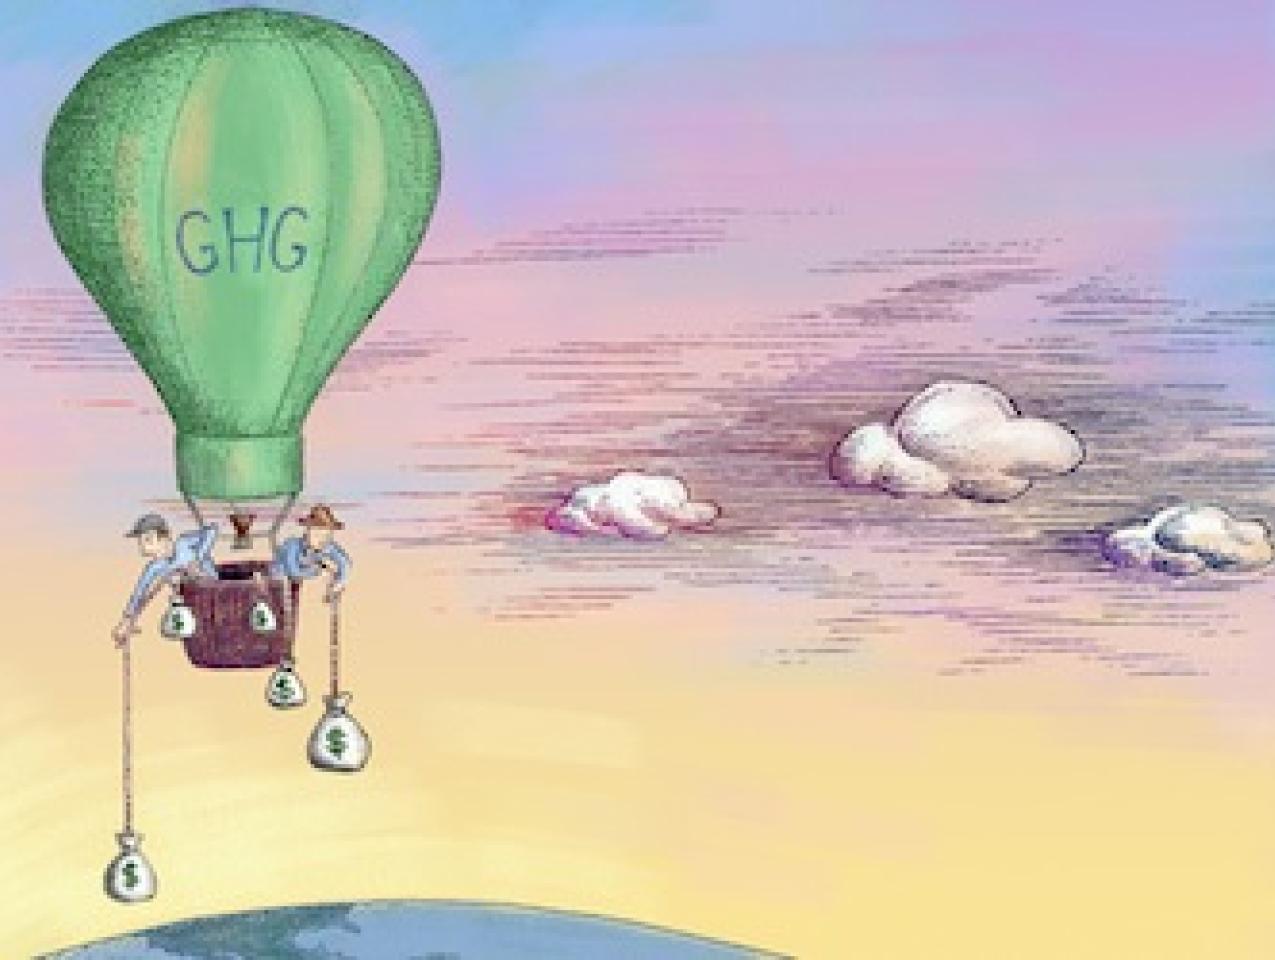
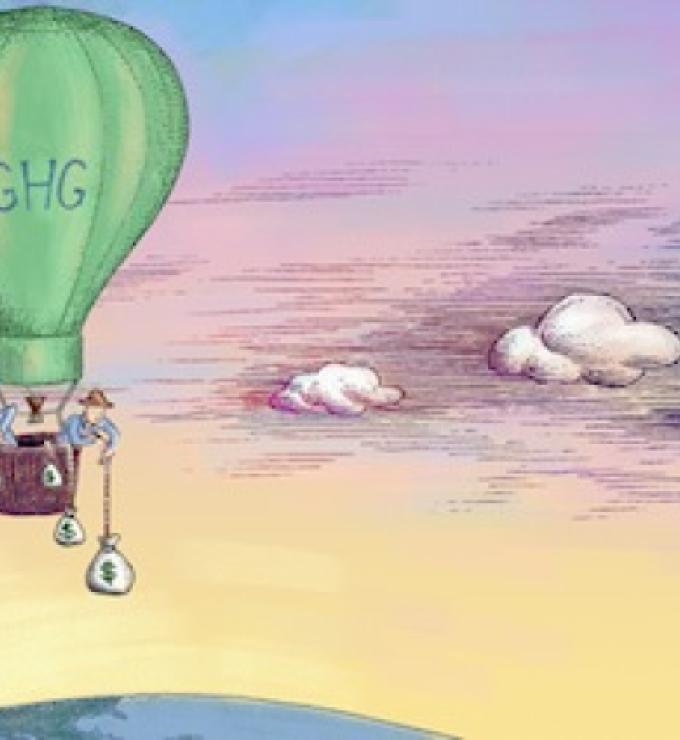
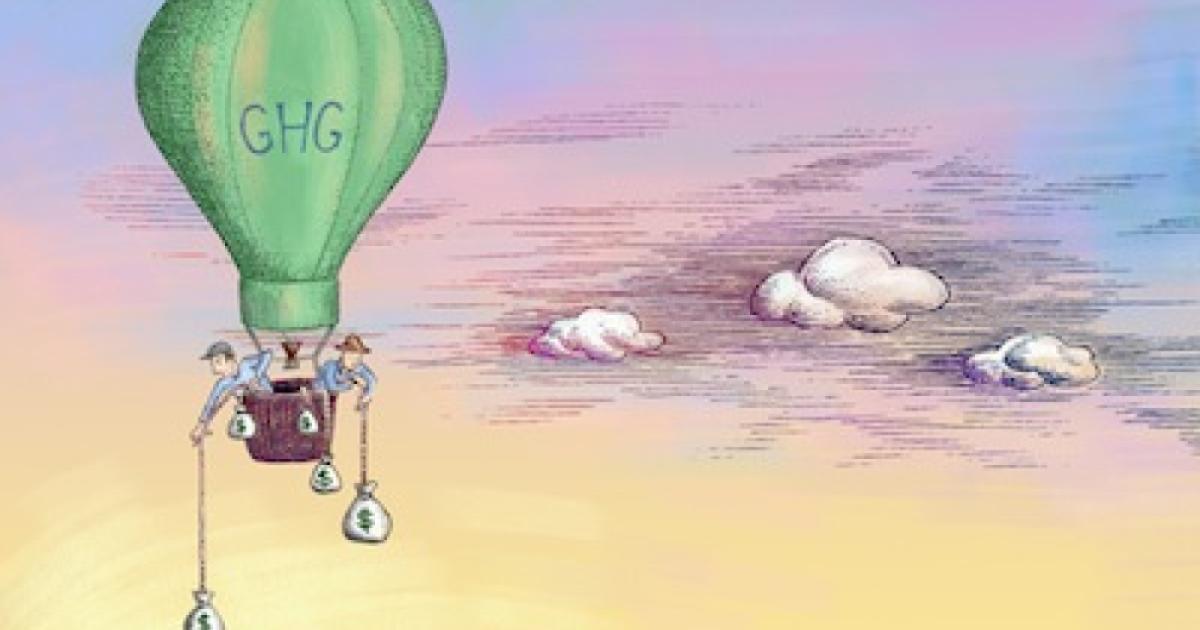
Many people view California as a leader in environmental policies. The hope is that the state will lead a reluctant U.S. Congress to encourage other states—and the Canadian provinces (and countries)—to adopt climate change regulations. There is great optimism among its supporters that California’s AB 32, the Global Warming Solutions Act of 2006, may create a cap-and-trade market to lower greenhouse gas (GHG) emissions.
The goal of AB 32 is to reduce GHG emissions in California to 1990 levels by 2020. The centerpiece of the legislation is cap-and-trade that applies to electricity suppliers, oil refineries, transportation fuel suppliers, and other large consumers of fossil fuels. Under the law, a company or utility must relinquish one allowance per ton of carbon dioxide (CO2) or the equivalent in heat-trapping gases it emits each year. The total amount of allowances is to be equal to the statewide cap, and each organization may only emit as much CO2 for which it has allowances. If it has excess allowances, they can be sold and if it has a shortage, they can be purchased. From these exchanges, a market price for CO2 emissions will emerge.

Illustration by Barbara Kelley
Each year, the cap is to be ratcheted down along with the allowances provided to meet the targeted emissions reduction. To prevent allowance price volatility, the cap-and-trade market is to have a rising floor price and ceiling. The state will intervene in the market to purchase permits if the price falls below the floor and issue additional permits if the price reaches the ceiling. The objective is to provide price certainty to encourage investment in green technologies.
Although a large economy, California is a small part of the world economy and its emissions are a tiny fraction of the worldwide total. If California achieves its goals, it will have only a miniscule impact on the stock of GHG in the atmosphere, and its reductions could be completely offset by increases elsewhere, such as in China. So what is the benefit of this unilateral action? Supporters of AB 32 emphasize the demonstration effect of a smooth-functioning cap-and-trade program that might lead to new GHG-saving technologies encouraged by the program.
So far, so good. But what about the costs? They depend in large part on how the California Air Resources Control Board designs and implements the program—if its rules are complex, not transparent, and involve considerable administrative intervention; if its actions are not moderated by statewide economic conditions; if it focuses on securing targeted auction revenues through the sale of additional permits; and if it adopts other regulations, such as tighter renewable fuel standards that affect permit prices, then the costs could be high with little environmental benefit. The hoped for demonstration effect would be a negative one, rather than what proponents seek.
All of this suggests a benign, well-informed, hands-off regulator will oversee AB 32. Unfortunately, the evidence is not very supportive of this notion and it comes from the three major cap-and-trade programs for emissions controls—the U.S. sulfur dioxide (SO2) market, the Regional Greenhouse Gas Initiative (RGGI) in the Northeastern and Mid-Atlantic states, and the European Union Emission Trading Scheme (EU ETS). In all three cases, permit prices have collapsed in light of political and bureaucratic intervention and weak property rights in allowance permits.
The U.S. SO2 Market.
This market developed out of the first large-scale air pollution controls implemented under the federal Clean Air Act Amendments of 1970 and 1977 to combat acid rain. Initially, uniform SO2 emissions mandates were decreed under the legislation by the Environmental Protection Agency (EPA) for U.S. power plants, regardless of their SO2 releases or costs of compliance. The total costs were astronomical. By 1990 they had reached $125 billion annually and emissions reductions still had not been met.
The Clean Air Act Amendments of 1990 authorized cap-and-trade and matters changed quickly. The SO2 releases declined by 50 percent, more than under previous regulations, and did so at a much lower cost. By 2007, the long-term targets were reached and at about one-third of the cost of command-and-control regulation. But this good news was not to last. Consider the pattern of emission permit prices shown in Figure 1. They begin quite stable, become very volatile, and are now virtually zero. What happened?
Initially, SO2 allowance trading was active, varying with the price of low-sulfur coal and natural gas that affected compliance costs, electricity demand, and regulatory changes. In 2000, the volume of inter-firm trading reached nearly 15 million allowances. This cap-and-trade market, however, soon faced regulatory and judicial interventions that ultimately undercut it and its ability to reduce SO2 releases at low cost.
Figure 1: SO2 Emissions Allowance Prices
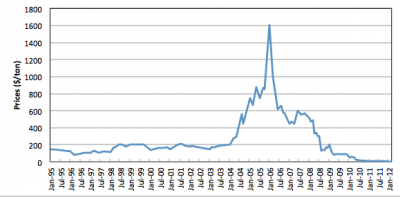
The problems began with EPA’s efforts to expand regulation of fine particulate emissions that are associated with SO2 releases from power plants. In 2005, the agency introduced the Clean Air Interstate Rule (CAIR) that reduced the cap on SO2 and nitrogen oxide (NO) emissions and focused these more stringent restrictions on particular utility facilities with high particulate releases in 28 states. The agency also changed the number of allowances that had to be surrendered for each ton of SO2 emissions from a 1:1 ratio to 2:1 for 2010-2014, and to a 2.86:1 ratio from 2015 on.
The higher allowance prices shown in the figure reveal the effects of Hurricanes Katrina and Rita in 2005 and these tighter CAIR rules. But after peaking in 2006, allowance prices began a rapid decline, eventually hitting zero. Why was that? CAIR rules were challenged successfully in the courts and struck down in 2008. After considerable policy recalibration, the EPA issued a new policy in 2011, the Cross-State Air Pollution Rule (CSAPR) that severely restricted interstate trading of allowances. Later in 2012, the Cross State Air Pollution Rule itself was invalidated by the courts. The EPA returned to command-and-control regulation, and the interstate SO2 allowance trading market was dead. What happened to the well-informed, hands-off, benign regulator?
The Regional Greenhouse Gas Initiative (RGGI)
Consider another example of cap-and-trade, the interstate effort to control CO2 emissions known as the Regional Greenhouse Gas Initiative. RGGI is designed to reduce CO2 releases by 10 percent between 2009 and 2018. The initiative was laid out in 2003 by the governors of nine Northeastern and Mid-Atlantic states—Connecticut, Delaware, Maine, Massachusetts, New Hampshire, New Jersey, New York, Rhode Island, and Vermont. First trading began in 2009.
Under RGGI, a regional cap is set, and emission allowances are auctioned four times a year to electric utilities in each participating state. Utilities can trade their allowances across participating states to meet the emissions cap set within their own state. High-cost emitters can buy allowances from those utilities that can reduce emissions at a lower cost. Again, in theory, this is fine and good, but consider the pattern of permit prices shown in Figure 2.
Figure 2: RGGI Auction Prices
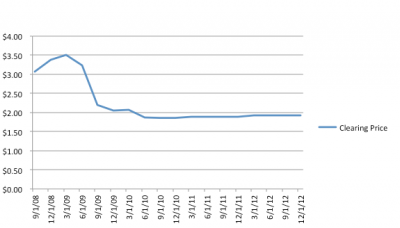
As shown in the figure, RGGI allowance auction prices have never been very high. They started out reaching about $3.50 per ton in early 2009 and then have sunk close to the regulated floor price of $1.89 per ton of emissions. They have never reached target prices of $20 to $30/ton, figures that are thought to reflect the global cost of carbon. What explains the price pattern of the allowances that otherwise is supposed to encourage utilities to consider the costs of CO2 releases in their production plans?
First off, there has been wavering political support for the cross-state effort, even with its relatively modest abatement objectives. Massachusetts and Rhode Island withdrew by 2005, only to rejoin in 2007 following new gubernatorial elections; Maryland also joined in 2007, but New Jersey withdrew at the end of 2011.As states leave or join RGGI, the overall cap has to be recalculated within a new group of participants, affecting overall emission reductions and the value of allowances that can be traded across the states.
As with AB 32, proponents are convinced that RGGI represents an important example of cross-state efforts to control CO2 releases, but others are not so sure. Because CO2 stocks float around the planet, reducing CO2 levels is a global problem. RGGI alone will have virtually no impact. Second, auction proceeds of over $1 billion by early 2013 are to be used to fund energy efficiency technologies and renewable energy, but new technologies, especially if mandated, can undermine permit prices. Moreover, New Jersey used its share to cover budget shortfalls.
There is little empirical evidence that politicians will adhere to commitments for expenditures in a particular manner, such as green technologies, across political jurisdictions and across time. Political commitments are especially problematical if citizens pay higher utility costs—as they are supposed to in order to use less energy—and see no direct benefits. Unless the rest of the world, particularly China, India, and Brazil, gets on board with CO2 abatement, RGGI’s efforts are unlikely to bear any CO2-reduction fruit, including any major development of new technologies.
When local economies are booming and unemployment is low, citizens may be more prepared to pay for improved environmental quality—but usually local environmental quality. Their patience with experiments, such as RGGI, that are meant to address global problems may be quite limited—and politicians will hear about it if there is wide-spread free-riding, as is likely.
Currently many of RGGI’s allowances remain unsold. RGGI plans to retire those excess allowances and, further, cut the emissions cap from 165 million tons to 91 million tons of CO2 to raise allowance prices and reduce CO2 releases. If northeastern economies continue to have slow growth and high unemployment, industry migrates, and CO2 emissions persistently rising elsewhere—as they have been—the governors, legislators, and regulators in the participating states are apt to feel political heat, and not just from global warming.
European Union Emission Trading Scheme (EU ETS)
Finally, consider the grand daddy of all emissions cap-and-trade markets, the European Union Emissions Trading Scheme, (EU ETS). The EU ETS covers more emission sources than the electric power plants covered by the U.S. SO2 trading program and RGGI—iron and steel, certain mineral industries including cement, oil refining, and pulp and paper facilities accounting for about 46 percent of the EU’s CO2 discharges. It is the largest cap-and-trade program in the world.
The EU ETS began in 2002 with a commitment among 15 western European countries to reduce CO2 emissions by 8 percent of the 1990 levels by 2008-2012. By 2007, the program had expanded to include 27 member countries (new eastern and southern European EU members) plus 3 non-members with the aim of lowering CO2 emissions by at least 20 percent by 2020 relative to 1990. There are three trading periods, 2005-2007, 2008-2012, and 2013-2020, with progressively lower caps.
The European Commission administers the overall CO2 target and member countries define their individual caps and allocate emission allowances to regulated firms. Tradable allocations are largely grandfathered to regulated facilities in the first two periods, but with more to be auctioned in the third. Each member country maintains its own registry, monitoring, reporting, and verification system.
At the end of each year, firms surrender allowances equivalent to their emissions at one allowance per one ton of CO2 released. Those firms with emissions below their allowances sell or bank the surplus, and those with excess emissions buy allowances. Companies trade directly with each other; employ a broker; or use a formal exchange. This exchange too, in theory, provides incentives to reach lower pollution targets in the most efficient manner.
But all is not well with this cap-and-trade market either, as indicated by the permit prices between 2005 and 2013 shown in Figure 3.
Figure 3: EU ETS Allowance Prices
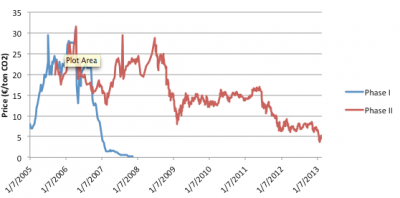
The figure shows the patterns of weekly emission permit futures prices for those trading during Phases I and II of the EU ETS program. Although there could be banking within periods, there was no banking across periods so that the two trading sessions are separate.
Phase I prices collapsed after April 2006 and then trended to zero by October 2007. The variation in Phase I prices was due to a very generous distribution of emissions allowances at the start of the program. This distribution followed political pressures across member governments and uncertainty as to how many allowances to distribute, as well as the inability of companies to bank them after 2007. Because there was no past trading of CO2 carbon allocations, there were no historical price data for benchmarking, and there was limited reliable emissions information at the facility level for grandfathering permits.
Subsequent price fluctuations during Phase II resulted from shifts in demand for energy from weather shocks, deteriorating macroeconomic conditions after 2008, and a continued abundant supply of allowances. Phase II prices fell from €30 ($43) in 2008 to record lows of €2.81 ($4.03) by January 2013. These prices also are far lower than the target price of €20, which was thought necessary to motivate firms to invest in new green technologies.
As with the other emission trading markets, prices are tumbling in the EU. What is going on? A general economic slowdown in Europe reduced demand for electricity and emission allowances, and the EU Commission in 2012 sold an additional 300 million permits to fund green energy projects, which further reduced prices. Finally, the EU introduced new command-and-control regulations on energy efficiency to lower emissions further, a factor not considered in setting the cap. The new regulations reduce demand for permits even still more. By 2020 it is estimated that the EU ETS could have a surplus of 845 million to 2.2 billion permits!
This condition will not only keep allowance prices low, but reduce incentives for firms to invest in emission-reduction technologies in lieu of purchasing (cheap) permits. The EU is considering intervening into the market by withholding enough permits to raise the price. But fewer permits, a tighter CO2 cap, and higher energy prices will be resisted by countries in the EU suffering from stagnant economic growth and loss of international competitiveness. A tug of war is developing between the European Commission and political leaders in member countries concerned with worsening economic outcomes.
Although the European Union is a much larger group of economies and is responsible for more CO2 emissions than RGGI, it alone can have little impact on the global problem—unless others follow along. But there is little empirical evidence or theory to suggest this is likely. Another possibility is that major new green technology breakthroughs occur, which is, again, possibly another dream. Meanwhile, local citizens bear the costs.
The Future of Market-Based Environmental Policies
These three similar instances of cap-and-trade experiments set a dismal precedent, especially for those who believe that AB 32 can provide a positive demonstration effect. Unfortunately, these market experiments have ignored some critical economic and political factors.
One is that the emissions allowances must be secure property rights, subject to takings protections. That means that they are shielded from arbitrary regulatory agency interventions as occurred in the SO2 market and is occurring in RGGI and the EU ETS. If agencies have to bear the costs of their actions that are unanticipated or unaccepted by permit holders, they will be more careful in doing so. Currently, these protections do not exist for emission permits under AB 32. There will be times when caps have to be adjusted, but the conditions for such an eventuality have to be outlined upfront and the factors made clear to all parties. Property rights security will add certainty to markets, reduce price volatility, and make long-term commitments for investment possible.
Second, proponents of regional cap-and-trade programs like AB 32, have to honest about their impact on global CO2 emissions. There is considerable misinformation about what local cap-and-trade can do for global problems. AB 32 will have no significant direct effect. Currently, advocates of tighter CO2 caps seek allowance prices that reflect the perceived cost of carbon in the hopes that this will stimulate adoption of similar trading markets elsewhere, investment in green technologies, and lower energy consumption. But actual consumers and citizens bear the costs and these actions, and they may not result in any global CO2 reductions or useful new technologies in light of rampant free-riding.
Third, AB 32 must be reflective of broader macroeconomic conditions in setting emissions targets. In slow economic times, citizens will have little patience for costly programs that have no observable impact, especially if regulation drives firms and jobs elsewhere. They may be more tolerant when times are good. Policy makers should be responsive to broad economic conditions and citizen concerns but the evidence of the three cap-and-trade markets presented here does not provide much optimism for such bureaucratic behavior and the success of AB 32.
