


- Health Care
[This article has been revised on April 6, 2020, and the updated version can be found here.]
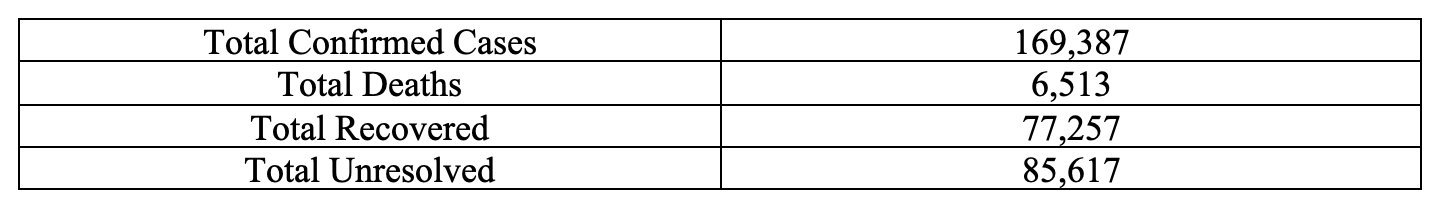
The world is in a full state of panic about the spread and incidence of COVID-19. The latest world-wide tallies, as of this writing are:
The most dramatic news of the day has been the sudden spike in the number of Italian cases, totaling 24,747 with 1,809 deaths, which may grow to exceed the 3,099 in China.
Overlooked is the good news coming out of China, where the latest report shows 16 new cases and 14 new deaths, suggesting that the number of deaths in the currently unresolved group will be lower than the 5.3 percent conversion rate in the cases resolved to date. In my view, we will see a similar decline in Italy, for reasons that I shall outline in the remainder of this article.
From this available data, it seems more probable than not that the total number of cases world-wide will peak out at well under 1 million, with the total number of deaths at under 50,000. In the United States, the current 67 deaths should reach about 5000 (or ten percent of my estimated world total, which may also turn out to be low).
[Correction & Addendum as of March 24, 2020:
My original erroneous estimate of 5,000 dead in the US is a number ten times smaller than I intended to state, and it too could prove somewhat optimistic. But any possible error rate in this revised projection should be kept in perspective. The current U.S. death toll stands at 592 as of noon on March 24, 2020, out of about 47,000 cases. So my adjusted figure, however tweaked, remains both far lower, and I believe far more accurate, than the common claim that there could be a million dead in the U.S. from well over 150 million coronavirus cases before the epidemic runs its course.]
[APRIL 21, 2020 EDITOR'S NOTE:
DUE TO AN EDITING ERROR, THE CORRECTION & ADDENDUM ABOVE IS INACCURATE. IT SHOULD STATE:
That estimate is ten times greater than the 500 number I erroneously put in the initial draft of the essay, and it, too, could prove somewhat optimistic. But any possible error rate in this revised projection should be kept in perspective. The current U.S. death toll stands at 592 as of noon on March 24, 2020, out of about 47,000 cases. So my adjusted figure, however tweaked, remains both far lower, and I believe far more accurate, than the common claim that there could be a million dead in the U.S. from well over 150 million coronavirus cases before the epidemic runs its course.
WE REGRET THE ERROR AND ANY CONFUSION IT HAS CAUSED]
Of course, every life lost is a tragedy—and the potential loss of 50,000 lives world-wide would be appalling—but those deaths stemming from the coronavirus are not more tragic than others, so that the same social calculus applies here that should apply in other cases.
These are deeply contrarian estimates. In dealing with any future prediction it is necessary to develop some model. Right now, the overwhelming consensus, based upon the most recent reports, is that the rate of infection will continue to increase so that the most severe interventions are needed to control what will under the worst of circumstances turn into a high rate of death. This pessimistic view is well captured in an op-ed by Nicholas Kristof and Stuart Thompson, who offer this graph to stress the importance and the immediacy of the looming crisis.
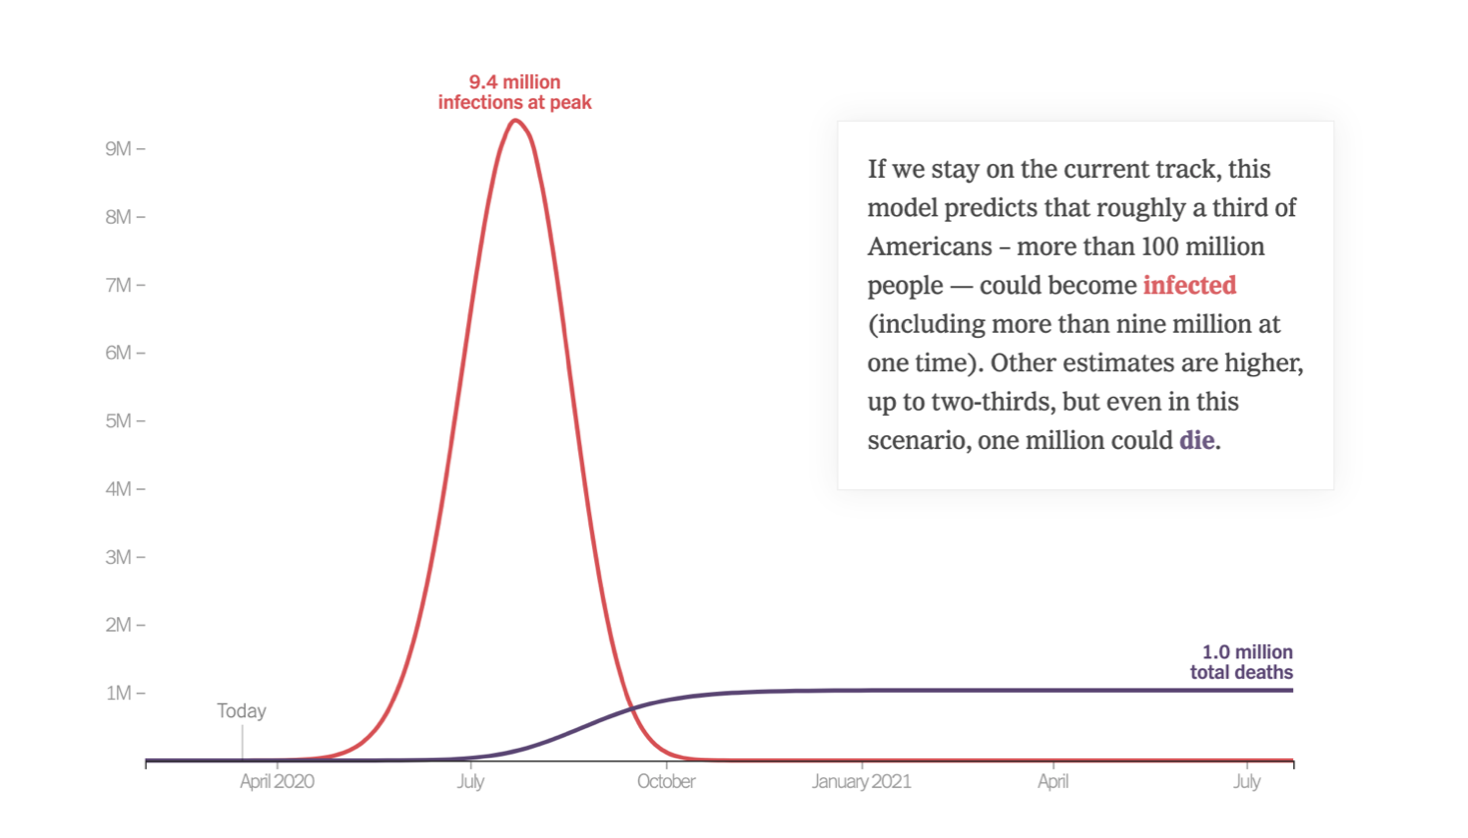
The model here projects a slow takeoff, a sharp rise, and an equally dramatic decline, with a huge cumulative total of deaths. The authors allow that if moderate precautions are taken, these totals might be reduced by about half. The key assumption of this model is a replication rate of 2.3, whereby each person who is infected then infects two others, seemingly without end. But the model does not specify the periodicity of the replication rate or allow it to vary with any downward changes in viral toxicity or human behavioral responses that delay interaction. Nor does the model recognize that if the most vulnerable people are hit first, subsequent iterations will be slower because the remaining pool of individuals is more resistant to infection. And finally, the model explicitly ignores the possibility that the totals will decline as the weather gets warmer.
The writer Tomas Pueyo has struck a similar chord with his viral post “Coronavirus: Why You Must Act Now.” That article contains graph after graph indicating an exponential expansion of cases in the last several days, and then claims that these infections will translate themselves into a similar number of deaths down the line unless radical countermeasures are taken.
Much of the current analysis does not explain how and why rates of infection and death will spike, so I think that it is important to offer a dissenting voice. In what follows, I look first at the trends in the American data, and then, building on my conclusions there, I construct a theoretical framework to evaluate the evolution of the coronavirus in other places.
Based on the data, I believe that the current dire models radically overestimate the ultimate death toll. There are three reasons for this.
First, they underestimate the rate of adaptive responses, which should slow down the replication rate. Second, the models seem to assume that the vulnerability of infection for the older population—from 70 upward—gives some clue as to the rate of spread over the general population, when it does not. Third, the models rest on a tacit but questionable assumption that the strength of the virus will remain constant throughout this period, when in fact its potency should be expected to decline over time, in part because of temperature increases.
As of March 16, the data from the United States falls short of justifying the draconian measures that are now being implemented. As of two days ago, 39 states have declared states of emergency, and they have been joined at the federal level with President Trump’s recent declaration to the same effect. These declarations are meant to endow governments with the power to impose quarantines and travel bans, close schools, restrict public gatherings, shut down major sporting events, stop public meetings, and close restaurants and bars. Private institutions are imposing similar restrictions. The one-two punch of public and private restrictions has caused a huge jolt to the economy.
The irony here is that even though self-help measures like avoiding crowded spaces make abundant sense, the massive public controls do not. In light of the available raw data, public officials have gone overboard. To begin with, the word pandemic should not be lightly used. Recall that the Spanish influenza pandemic, fully worthy of the name, resulted in perhaps as many as a half-billion infections and between 50 and 100 million deaths, world-wide, of which some 675,000 were Americans, many coming back from Europe in the aftermath of the First World War. The World Health Organization recently declared coronavirus a pandemic at a time when the death count was at 4,000, presently being just over 6,500. It will surely rise no matter what precautions are taken going forward, but what is critical is some estimate of the rate.
By way of comparison, the toll from the flu in the United States since October ran as follows: between 36 to 51 million infections, between 370 thousand to 670 thousand flu hospitalizations, and between 22 thousand to 55 thousand flu deaths. That works out to between roughly between 230,000 to 320,000 new infections per day, and between 140 to 350 deaths per day for an overall mortality rate of between 0.044 percent to 0.152 percent.
As we think about the mortality rate of COVID-19, there are some important pieces of data to consider. The chart below documents the most current numbers reported by the New York Times (as of March 16) for the four hardest hit states:
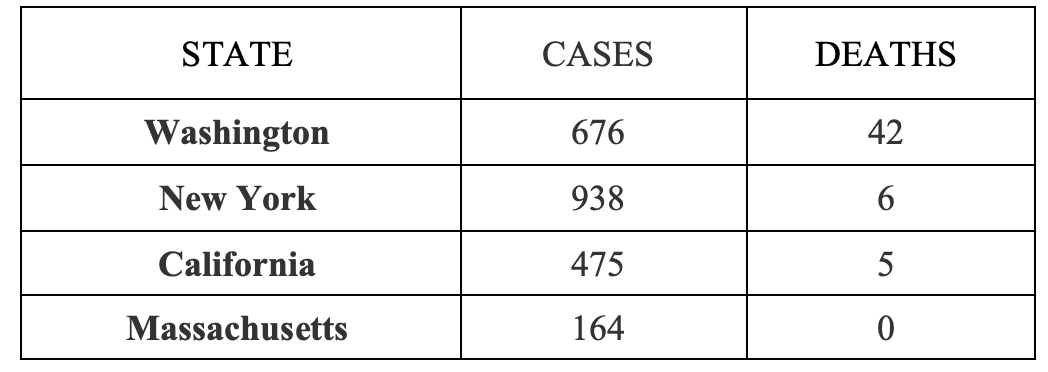
Note that Washington state, with 676 reported cases and 42 deaths, has a mortality rate of 6.21 percent, which can be traced to a nursing facility in Kirkland Washington. While only contributing 57 cases, it was the source of 27 of the reported deaths, almost two-thirds of the fatalities. (We should expect, as has been the case, that the mortality rate in Washington will decline as the newer cases will not come exclusively from that high-risk population.) The next three states have 1,577 diagnosed cases and 11 deaths for a mortality rate of 0.69 percent, a number which has trended lower over the last few days. Unlike the deadly exposures in Kirkland, the exposures in New York state produced many documented illnesses, but only two deaths even after two weeks of exposure. And while it is easy to miss latent cases, it is harder to miss any virus-related death. Given that the incubation period is about two-weeks, the pool of cases before March 1 should be small.
Many of the dire media accounts do not mention evolution. After the initial outburst in Kirkland, the target population was fitter. It is instructive therefore to look at the total number of cases, which spiked from 70 cases on March 5 to 672 cases on March 15. But those figures do not presage an increase into the thousands of daily cases that would be needed to reach the totals of the flu season. The current numbers are about 3 per cent of the rate of new flu cases in the 2019-2020 virus season. Even if there is some undercounting, it is highly unlikely, given the relatively short (two-week) incubation period, that the number of current cases will more than double or triple. It is also unlikely that most of the increase in reported cases (as opposed to deaths) will be in the population over age 70. More importantly, these numbers, as reported by the Centers for Disease Control, do not give any indication of heightened severity.
What, then, does all of this portend for the future of COVID-19 in the United States? Good news is more likely than bad, notwithstanding the models that predict otherwise. The deaths in Washington have risen only slowly, even as the number of infections mount. The New York cases have been identified for long enough that they should have produced more deaths if the coronavirus was as dangerous as is commonly believed.
But why might the dire predictions be wrong? Consider the New York Times graphic below, which catalogs the daily totals of new coronavirus cases:
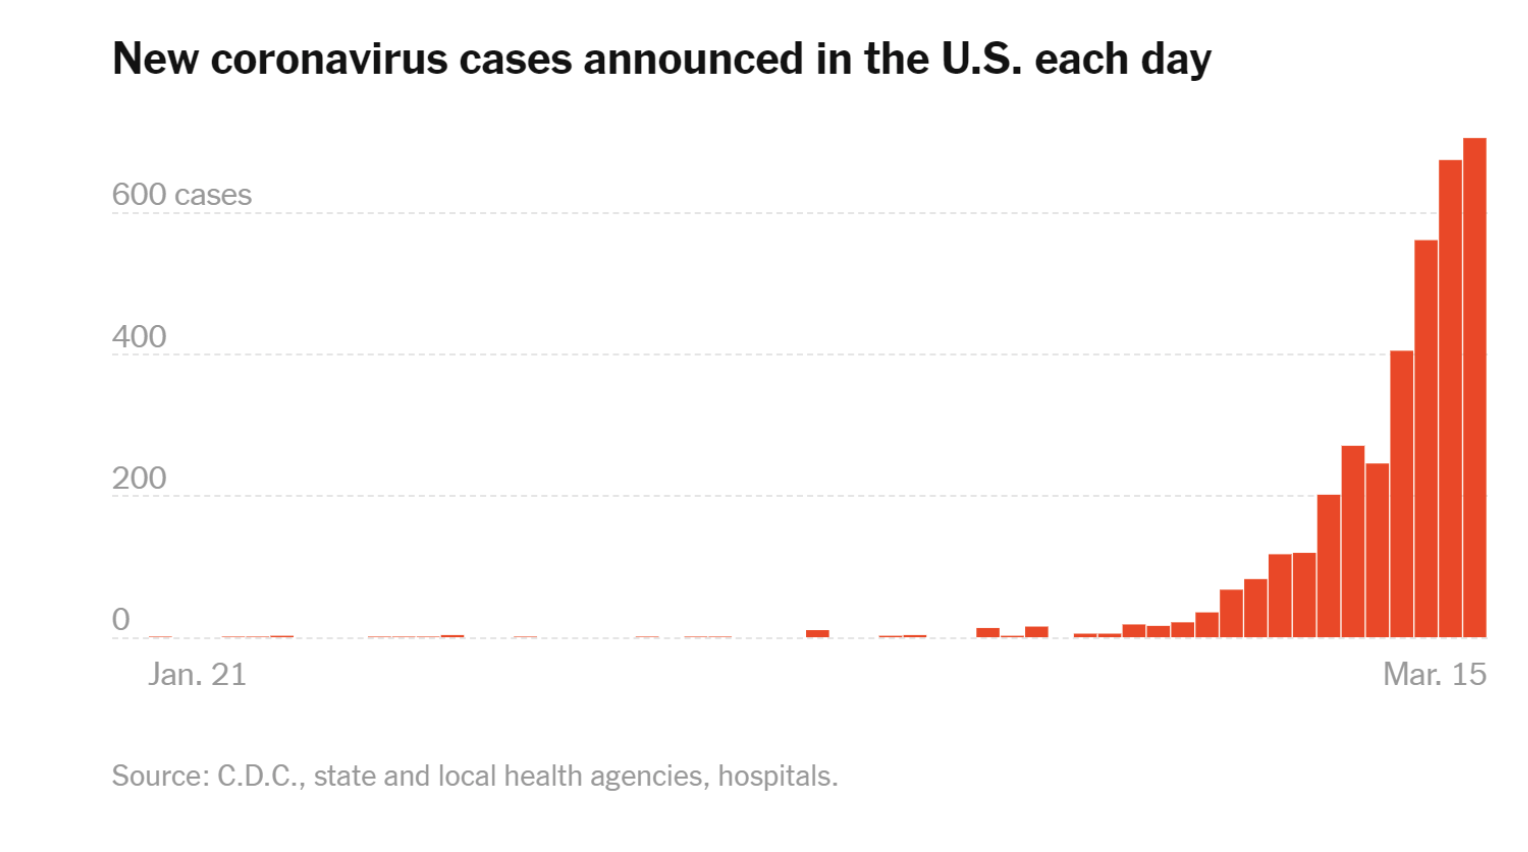
The theoretical answer to the question of how deadly the virus will turn out lies in part in a strong analytical relationship between the rate of spread and the strength of the virus. Start with the simple assumption that there is some variance in the rate of seriousness of any virus, just as there is in any trait for any species. In the formative stage of any disease, people are typically unaware of the danger. Hence, they take either minimal or no precautions to protect themselves from the virus. In those settings, the virus—which in this instance travels through droplets of moisture from sneezing and bodily contact—will reach its next victim before it kills its host. Hence the powerful viruses will remain dominant only so long as the rate of propagation is rapid. But once people are aware of the disease, they will start to make powerful adaptive responses, including washing their hands and keeping their distance from people known or likely to be carrying the infection. Various institutional measures, both private and public, have also slowed down the transmission rate.
At some tipping point, the most virulent viruses will be more likely to kill their hosts before the virus can spread. In contrast, the milder versions of the virus will wreak less damage to their host and thus will survive over the longer time span needed to spread from one person to another. Hence the rate of transmission will trend downward, as will the severity of the virus. It is a form of natural selection.
One key question is how rapidly this change will take place. There are two factors to consider. One is the age of the exposed population, and the other is the rate of change in the virulence of the virus as the rate of transmission slows, which should continue apace. By way of comparison, the virulent AIDS virus that killed wantonly in the 1980s crested and declined in the 1990s when it gave way to a milder form of virus years later once the condition was recognized and the bath houses were closed down. Part of the decline was no doubt due to better medicines, but part of it was due to this standard effect for diseases. Given that the coronavirus can spread through droplets and contact, the consequences of selection should manifest themselves more quickly than they did for AIDS.
It is instructive to see how this analysis fares by taking into account the Korean data, which is more complete than the American data. South Korea has been dealing with the coronavirus since January 20. Since that time, the Korean government has administered a total of 261,335 tests to its citizens. In press releases updated every day, the Korean CDC is reporting (as of March 15) 8,162 total infections against 75 deaths for an overall mortality rate of 0.92 percent. But as shown in the table below, the age-disparity in outcome is striking:
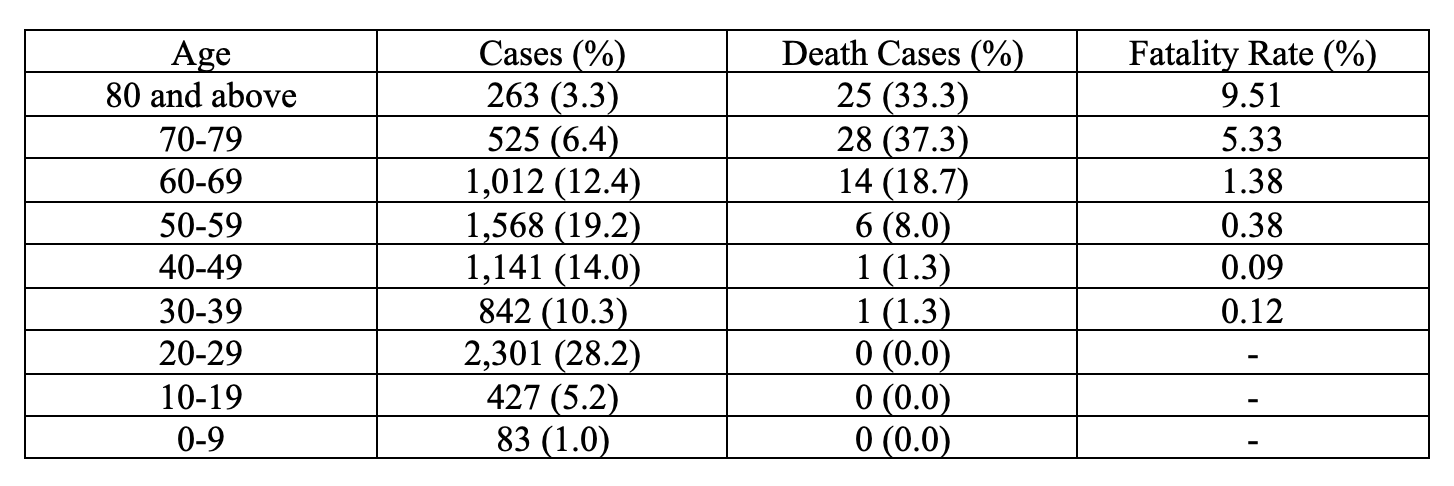
Clearly, the impact on elderly and immunocompromised individuals is severe, with nearly 90% of total deaths coming from individuals 60 and over. But these data do not call for shutting down all public and private facilities given the extraordinarily low rates of death in the population under 50. The adaptive responses should reduce the exposures in the high-risk groups, given the tendency for the coronavirus to weaken over time. My own guess is that the percentage of deaths will decline in Korea for the same reasons that they are expected to decline in the United States. It is highly unlikely that there will ever be a repetition of the explosive situation in Wuhan, where air quality is poorer and smoking rates are higher.
So what then should be done?
The first point is to target interventions where needed, toward high-risk populations, including older people and other people with health conditions that render them more susceptible to disease. But the current organized panic in the United States does not seem justified on the best reading of the data. In dealing with this point, it is critical to note that the rapid decline in the incidence of new cases and death in China suggests that cases in Italy will not continue to rise exponentially over the next several weeks. Moreover, it is unlikely that the healthcare system in the United States will be compromised in the same fashion as the Italian healthcare system in the wake of its quick viral spread. The amount of voluntary and forced separation in the United States has gotten very extensive very quickly, which should influence rates of infection sooner rather than later.
Perhaps my analysis is all wrong, even deeply flawed. But the stakes are too high to continue on the current course without reexamining the data and the erroneous models that are predicting doom.
