


- State & Local
- Fiscal Policy
Last week, Chris Edwards, a budget policy analyst at the Cato Institute, and Ilana Blumsack, his research associate, issued an extensive report in which they graded the fiscal policy records of forty-six of America’s fifty governors. Why only forty-six? The authors explain that the governors of New York, Rhode Island, and Virginia had not been in office long enough to establish a record and that Alaska’s governor was excluded because of “peculiarities in that state’s budget.” When I read analyses of taxes and spending by governments in the United States, I expect mainly bad news. To be sure, there’s much of that in their report, but there’s also a large amount of good news.
We often hear that there’s not much difference between the policies of Republicans and Democrats. But Edwards and Blumsack show that, at the state level, there are huge differences between the top Republicans and the bottom Democrats. Specifically, the five governors who earn an A for their tax cutting and budget restraint are Republicans: Kim Reynolds of Iowa, Chris Sununu of New Hampshire, Pete Ricketts of Nebraska, Brad Little of Idaho, and Doug Ducey of Arizona. The eight governors who earn an F are Democrats: Tim Walz of Minnesota, Tom Wolf of Pennsylvania, J. B. Pritzker of Illinois, Gretchen Whitmer of Michigan, Phil Murphy of New Jersey, Kate Brown of Oregon, Gavin Newsom of California, and Jay Inslee of Washington. These aren’t just opinions; the authors go into great detail about the governors’ accomplishments or lack of same.
Tax Cuts and Spending Restraint
All the states have something going for them that makes their fiscal records better than that of the federal government: they can’t print money. This means that they can’t finance a budget deficit by buying their own bonds. Most of the states have another feature that causes them not to run perpetual budget deficits: a requirement that they balance their budgets.
Those two features together, and even the second one on its own, mean that for most states, there is a tight connection between government spending and taxes. If a state government wants to cut taxes or even cut the growth of tax revenue, its governor and legislature must figure out ways to cut spending or cut the growth of spending.
When state governments actually manage to cut taxes, that’s more of an accomplishment, therefore, than when the federal government cuts taxes. Although the report’s authors, Edwards and Blumsack, focus on the governors, the accomplishment is typically due not just to the governor but also to the legislatures.
The Top Five
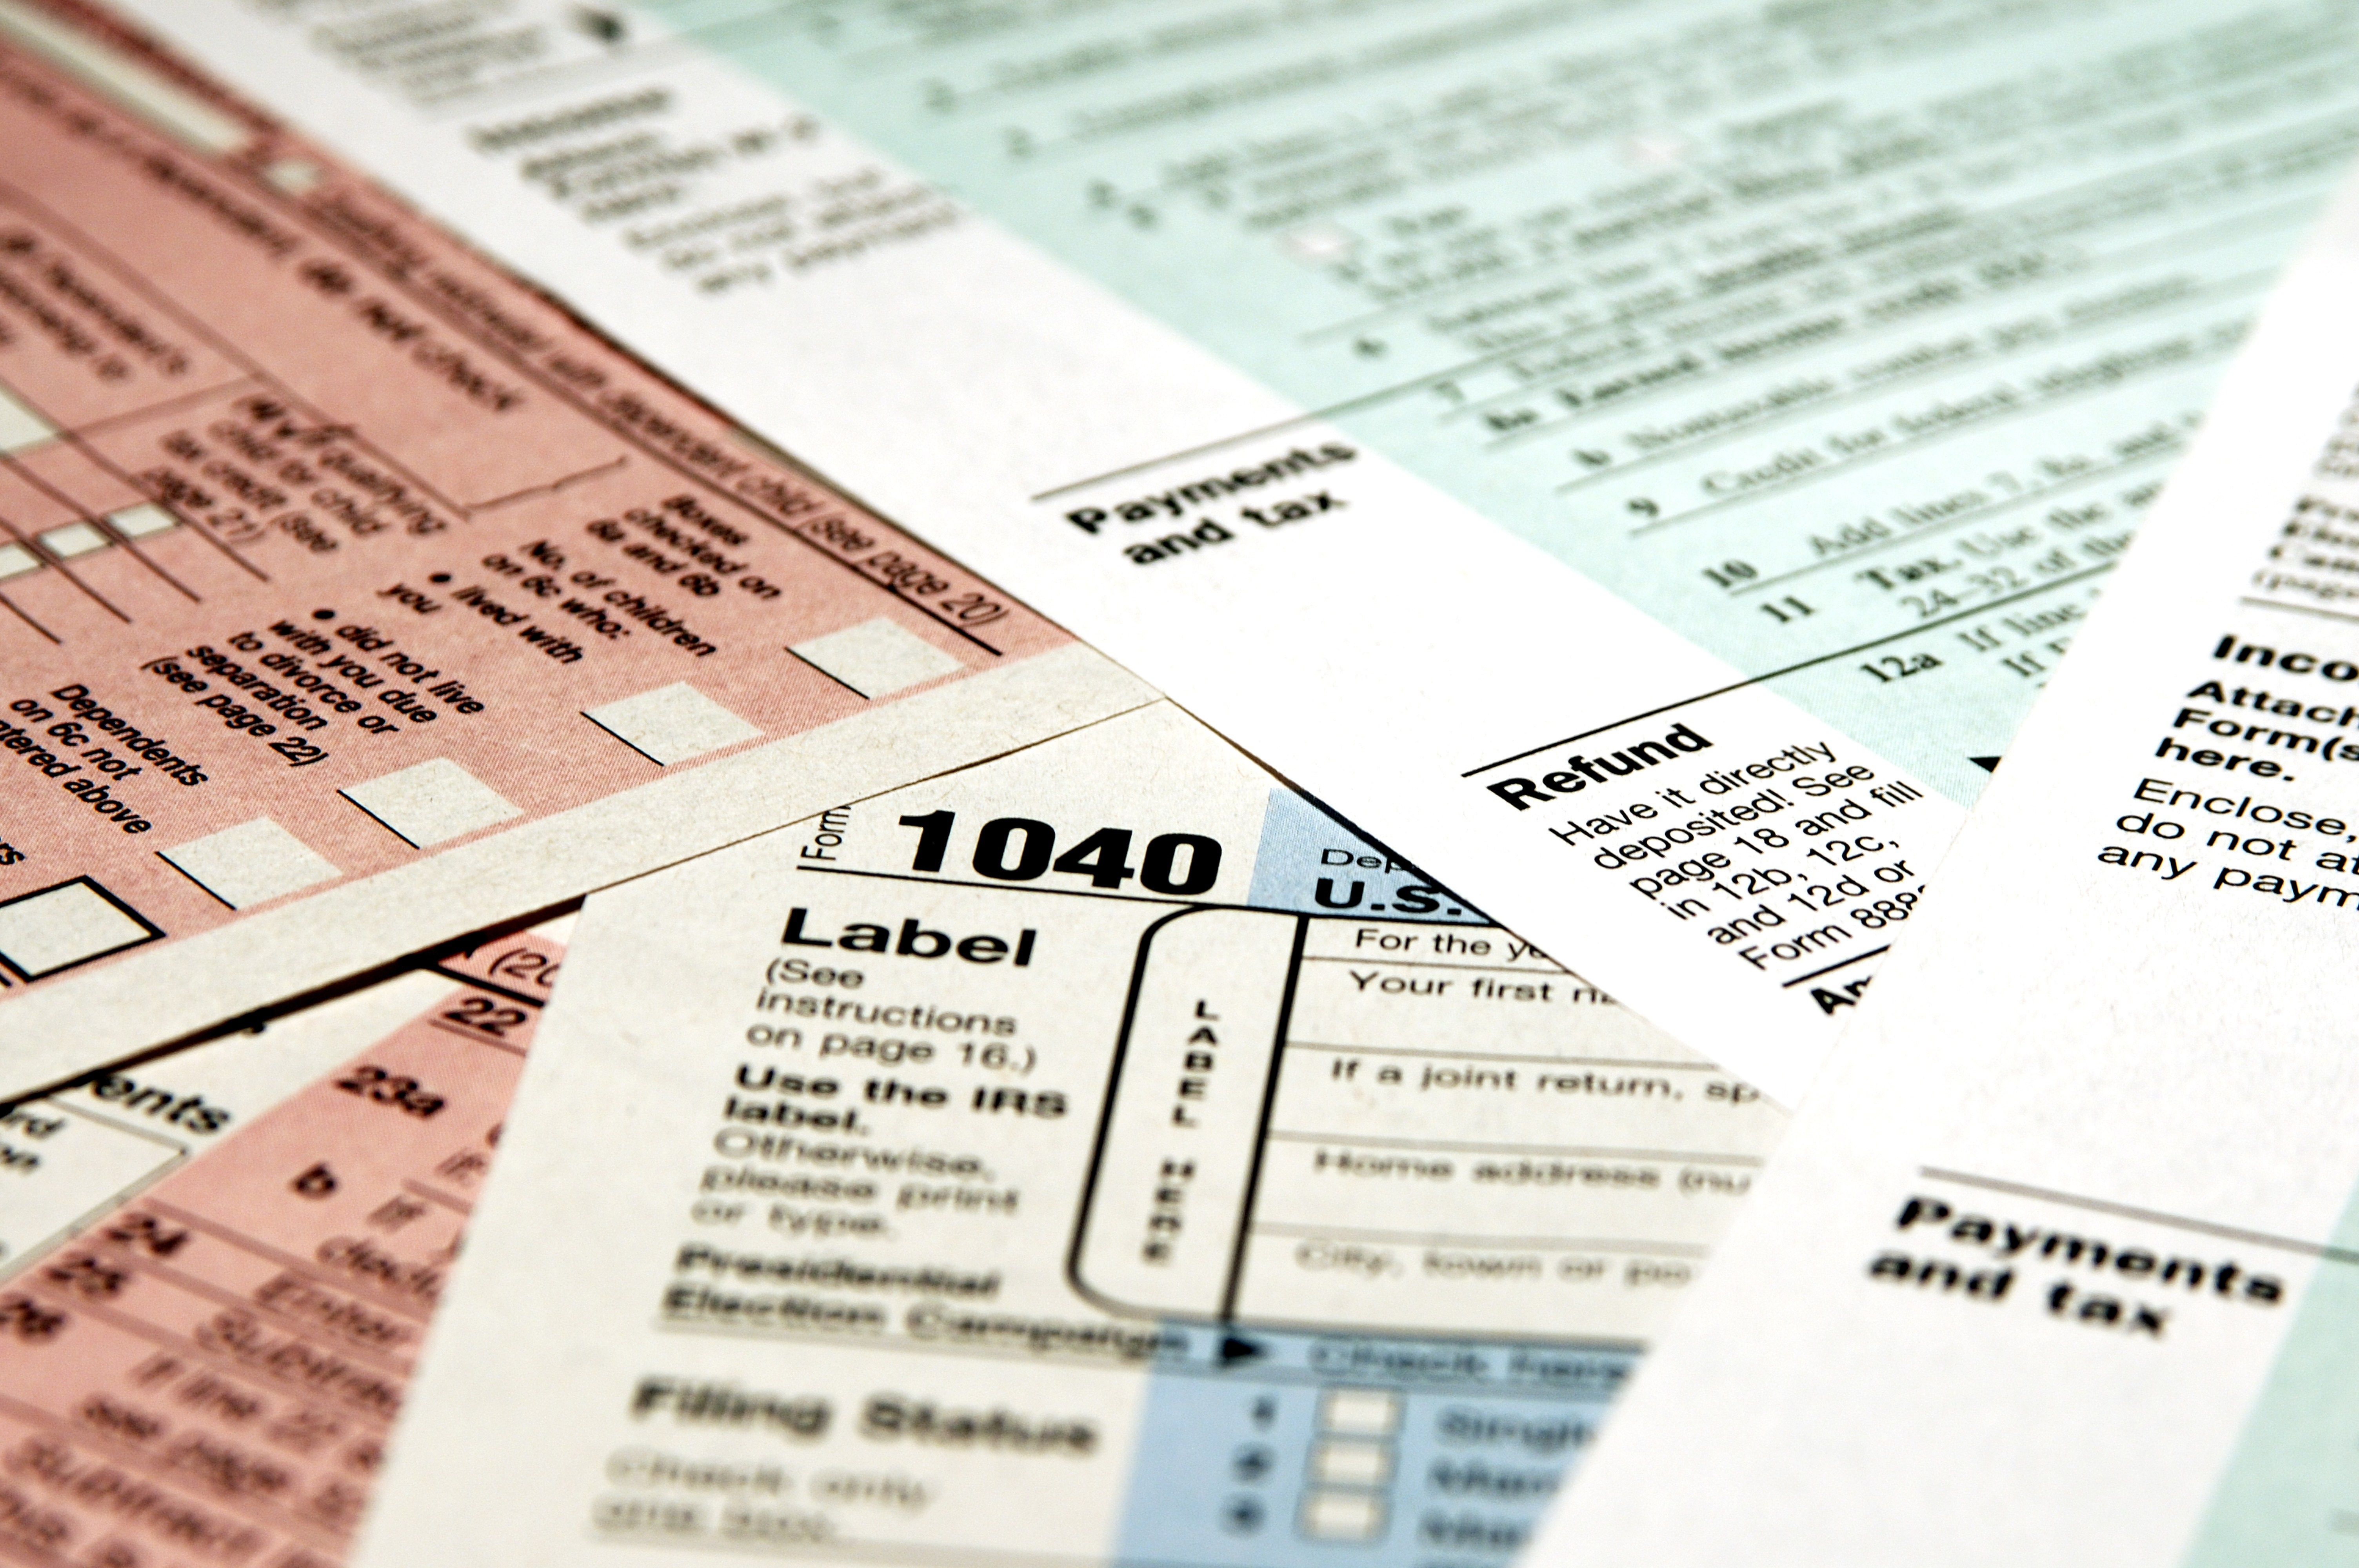
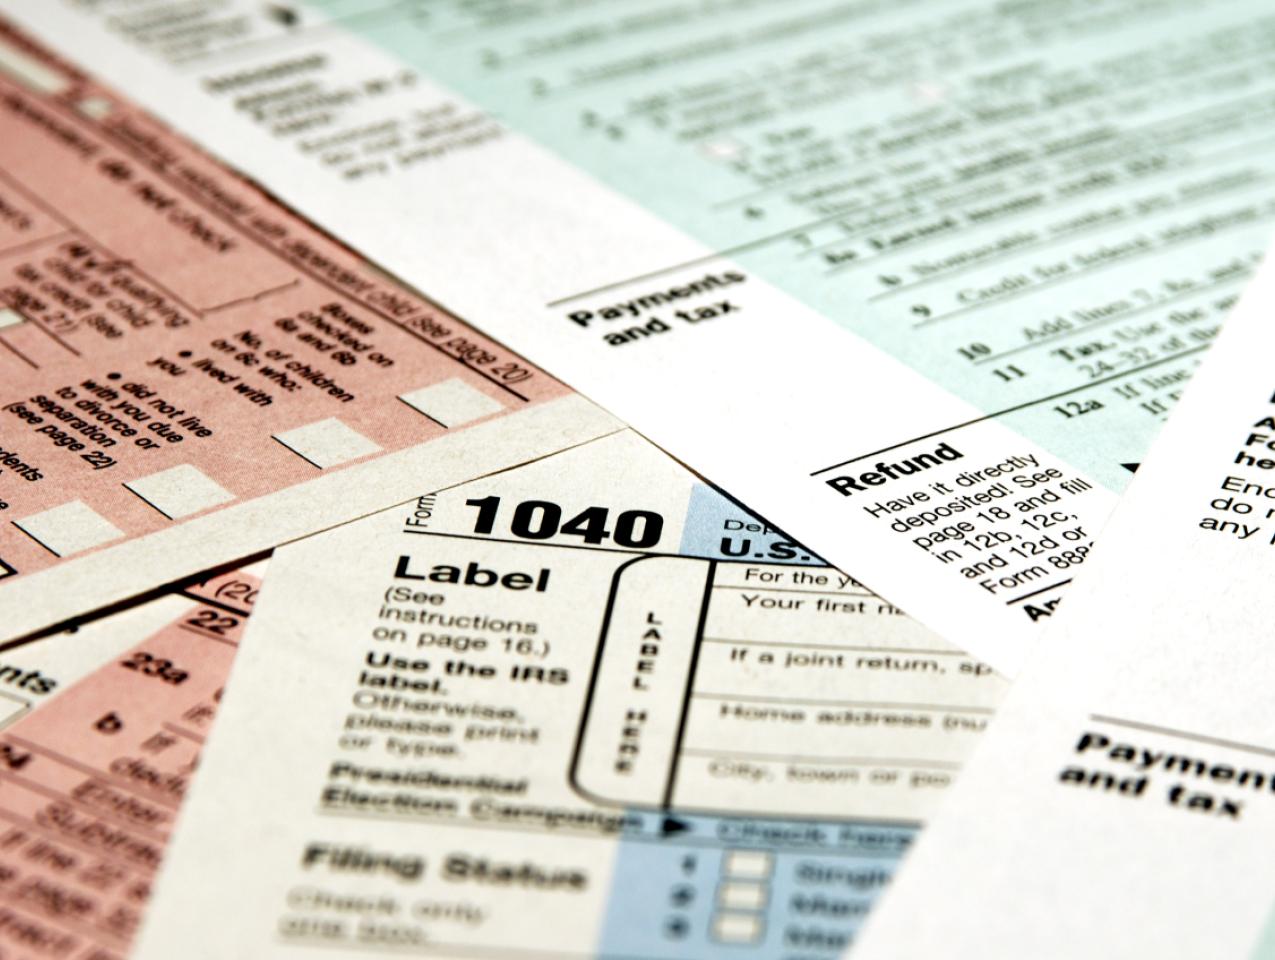
Let’s consider the specific accomplishments of five governors who earned at A, starting with the top governor, Kim Reynolds of Iowa. Since Reynolds became governor in 2017, general fund spending has risen by only 2.3 percent a year. Edwards and Blumsack’s data go to August 2022. From 2017 to August 2022, the consumer price index rose by 46.3 percent. That means that the annual average inflation rate over that time was 6.9 percent. So government spending in real terms shrank substantially. This allowed Reynolds to cut corporate and individual income taxes in 2018 and abolish Iowa’s inheritance tax in 2021. Moreover, in 2022, she signed legislation that will eliminate Iowa’s graduated income tax that has nine brackets, and a top bracket of 8.98 percent, and put everyone in a 3.9 percent bracket. In short, she has moved Iowa from being a state with fairly high marginal tax rates to one with a flat tax rate that’s fairly low.
Next comes New Hampshire’s Chris Sununu, who has done even better than Reynolds on state government spending. Since he became governor in 2017, general fund spending has grown by an average of 1.1 percent per year, well below the inflation rate. This allowed him the leeway to sign legislation in 2021 that ends New Hampshire’s 5 percent tax on interest and dividends. New Hampshire will soon, therefore, be a no-income-tax state. Too bad it’s so cold.
Pete Rickets of Nebraska has even a longer history of restraining the growth of government spending. From 2015 to 2022, he kept the average annual growth rate of general fund spending at 2.6 percent. He cut the top corporate tax rate from 7.81 percent to 5.84 percent and the top individual income tax rate from 6.84 percent to 5.84 percent.
Brad Little of Idaho and Doug Ducey of Arizona were also successful at cutting individual income tax rates.
The Bottom Eight
The worst eight governors at restraining spending and cutting taxes, from least bad to worst, were Tim Walz of Minnesota, Tom Wolf of Pennsylvania, J. B. Pritzker of Illinois, Gretchen Whitmer of Michigan, Phil Murphy of New Jersey, Kate Brown of Oregon, Gavin Newsom of California, and Jay Inslee of Washington.
Because a comprehensive analysis of the policies of all eight would take too much space, I recommend perusing the study and focusing on the particular governors and states you’re interested in. But a few highlights are worth noting.
Consider the most populous state in the union, California. The authors note that under Governor Newsom, general fund spending rose from $146 billion in 2020 to $240 billion in 2022. That’s an average annual increase of 28 percent, a multiple of the average annual inflation rate. (Why not 32 percent, which you would get by dividing the 64 percent increase over two years by two? Don’t forget that growth in government spending, like interest, compounds.) Moreover, they note, California, whose government imposes a large part of the tax burden on high-income households, “is losing two households earning more than $200,000 for every one that it gains.” That means that there’s a substantial probability that California’s government will not be able to sustain the higher spending in the longer run.
Another extreme case is that of Oregon’s Kate Brown, whose grade makes her the third-worst governor, judged by tax and spending policies. Between 2015, when she became governor, and 2022, general fund spending has risen by an annual average of 6.4 percent. Even when state government revenues were increasing substantially, she pushed for new taxes. She and the legislature, despite the voters’ 2016 rejection of a gross receipts tax, imposed one anyway in 2019. It is levied on corporate and non-corporate businesses and raises about $1 billion per year. This is a large amount in a state whose population is only 4.2 million; the per capita take from that one tax alone is $238 annually.
Federal Subsidies Enable Cuts in Tax Rates
One factor that made it relatively easy for many state governments to cut tax rates was the huge federal subsidies to states that Congress legislated and both Presidents Trump and Biden agreed to. The subsidies, legislated in 2020 and 2021, totaled about $1 trillion. To put that number in perspective, note that state general fund spending in 2020 and 2021 totaled about $1.8 trillion. That means that the feds financed about half of state government spending during those two years. (As an aside, I should note that the case for bailing out the state governments during COVID was weak from the get-go; I pointed this out in “Just Say No to State & Local Bailouts” (Defining Ideas, June 3, 2020.) While those subsidies were temporary, they caused many state governors, typically Republicans, to cut certain tax rates permanently. While some analysts might think this unwise, my own view is that it’s quite wise; when the subsidies disappear, the legislature and governor will be forced to live with a budget that is leaner than otherwise.
What I find most interesting about this use of temporary subsidies to enable permanent cuts in tax rates is the evidence on what economists call the “flypaper effect.” The three economists who, in 1979, noted the effect and gave it its name were Paul N. Courant, Edward M. Gramlich, and Daniel L. Rubinfeld. The idea is that money “sticks where it lands.” If the federal government gives money to state and local governments, the increase in government due to that grant is greater than the increase due to an increase in private income in the jurisdiction.
If you peruse the data that Edwards and Blumsack lay out in their Cato report, you can certainly see the flypaper effect in action. Among the most notorious decision makers, in this regard, are Governor Newsom and California’s legislature. California is effectively a one-party state. Newsom, as noted, is a Democrat; California’s Senate has thirty-one Democrats and nine Republicans; the Assembly has sixty Democrats, nineteen Republicans, and one independent. Newsom and the legislature would not likely have increased state government spending as much as they did had the federal government not given them such large grants.
On the other hand, there is good news for those who, like me, think that much government spending is wasted: the apparent absence of a flypaper effect in many states. Many governors, and not just the five Republicans who received a grade of A, used the slack that the federal government had given them to make substantial cuts in income tax rates on individuals and on corporations. Edwards and Blumsack note that twenty-one state governments “have cut individual or corporate income tax rates since 2020.”
In 2021 and 2022, sixteen of the governors signed laws that reduced the top tax rates on individual income. Edwards and Blumsack list them: “Doug Ducey of Arizona, Asa Hutchinson of Arkansas, Brian Kemp of Georgia, Brad Little of Idaho, Eric Holcomb of Indiana, Kim Reynolds of Iowa, John Bel Edwards of Louisiana, Tate Reeves of Mississippi, Mike Parson of Missouri, Greg Gianforte of Montana, Pete Ricketts of Nebraska, Roy Cooper of North Carolina, Mike DeWine of Ohio, Kevin Stitt of Oklahoma, Henry McMaster of South Carolina, and Spencer Cox of Utah.” Of these sixteen, only two, Edwards of Louisiana and Cooper of North Carolina, are Democrats.
The report’s authors also write:
During 2021 and 2022, ten governors signed into law cuts to the top corporate income tax rate: Asa Hutchinson of Arkansas, Brad Little of Idaho, Kim Reynolds of Iowa, John Bel Edwards of Louisiana, Pete Ricketts of Nebraska, Chris Sununu of New Hampshire, Roy Cooper of North Carolina, Kevin Stitt of Oklahoma, Tom Wolf of Pennsylvania, and Spencer Cox of Utah.
Of these ten, only three—Edwards, Cooper, and Wolf—are Democrats.
In short, at the state level, there is a major difference in tax policy between Republicans and Democrats.
Where Does the Money Go?
Many people favor state government spending because they want some of the good things that state governments can deliver. One thing that almost everyone can agree on is that it would be nice not to have potholes on roads and garbage at the sides of roads. So a more complete study than the Cato report might look at such indicators. That’s a big ask and the report is valuable even without those indicators. My casual empiricism, though, based on driving mainly in California, is that for all the California government spends, its major freeways, especially in urban areas, are a disgrace. They have many potholes and garbage lines the roads. Often what we get for our money is more welfare and more feathering of nests of politically favored people.
I don’t know about you, but I would rather have my tax rates cut.

