- Economics
What's Behind the Numbers? allows authors to provide additional insight and an explanation into how they arrive at their conclusions. It consists of the data files, calculations, and other materials that inform the analysis but do not traditionally fit into an op-ed.
This is the statistical backup for the statements Edward P. Lazear made in the January 10, 2019 The Wall Street Journal op-ed “Why the Fed Should Heed the Market."
Data from the past four decades shows that a 10% decrease in the S&P 500 over a period of either three or six months is associated with a decrease of about 0.5 percentage point in the following year’s GDP growth. (The average change in the S&P during a three month period is plus or minus 6%.)
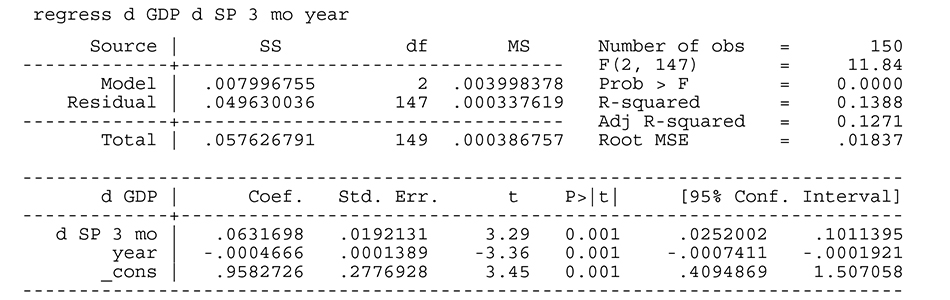
The precipitous decline in the S&P, down about 12% from its October peak, implies that the market expects growth in the next year to fall short of the Fed’s 2.3% prediction. Today’s market values imply that next year’s growth will be about three-fourths a percentage point lower than what the same model would have predicted just three months ago.

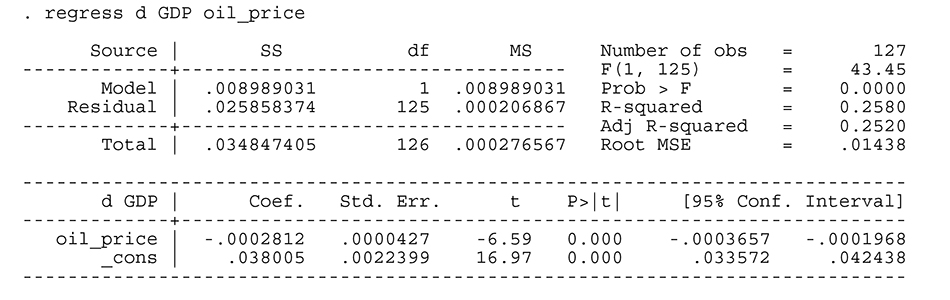
Another factor that correlates with future growth—inversely—is the price of oil: A drop in oil prices of $10 a barrel corresponds to a roughly 0.25-percentage-point boost in GDP growth the following year.
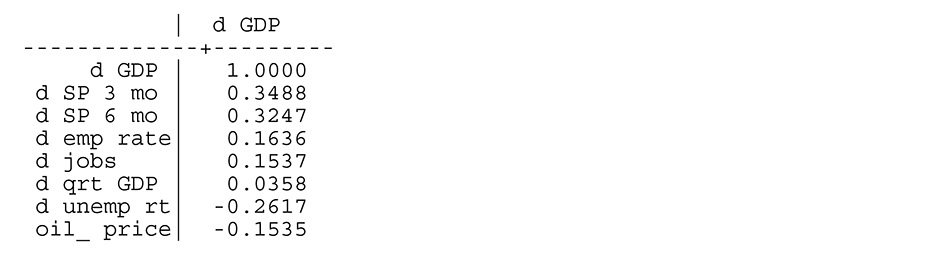
But over the past decade market value has been the indicator most strongly correlated with future growth. Correlations over past 10 years: