


- Education
Although the No Child Left Behind (NCLB) Act requires all students to be “proficient” in math and reading by 2014, the precedent-setting 2002 federal law also allows each state to determine its own level of proficiency. This odd discordance has led to the bizarre situation in which some states achieve handsome proficiency results by grading their students against low standards, and others suffer poor proficiency ratings only because they have high standards.
To quantify this discrepancy—to show which states are upholding rigorous standards and which are not—we used the National Assessment of Educational Progress (NAEP), the nation's “report card” and still the only metric that allows strict comparisons between states. For each state where both the NAEP and the state accountability measures were available, we computed a score based on the difference between the percentage of
students said to be proficient by the state and the percentage identified as proficient on the NAEP in the years 2003 and 2005.
We are not evaluating state tests or grading states on the performance of their students. Instead, we are checking for “truth in advertising” (whether the proficiency levels mean what they say) in order to ascertain whether states lowered the bar for student proficiency as the NCLB provisions took effect. Clearly, student proficiency has entirely different meanings in different parts of the country.
Grading Procedure
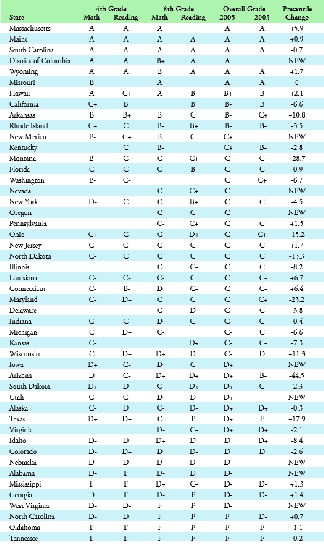
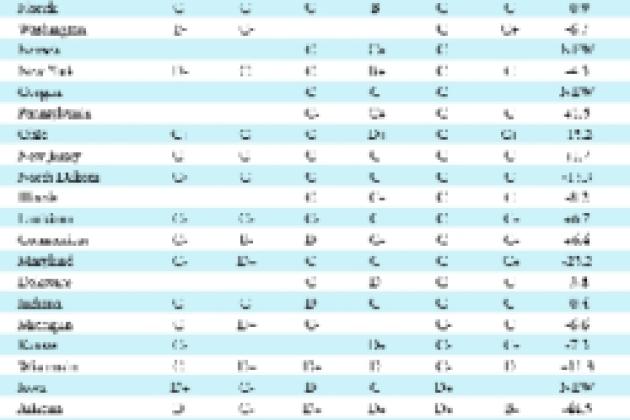
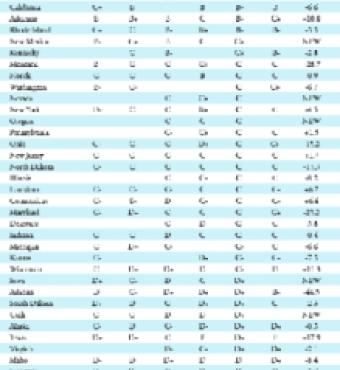
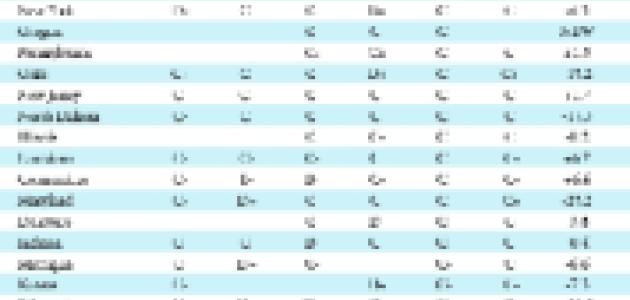
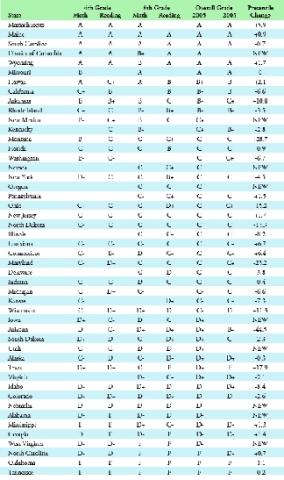
In 2003 and 2005, both state and NAEP tests were given in math and reading to fourth-grade students. The grades reported here, then, are a comparison of state and NAEP proficiency scores in 2005; changes in each are calculated relative to 2003 (see figure 1). For each available test we computed the difference between the percentage of students who were proficient on the NAEP and the percentage reported as proficient on the state's own tests for the same year as well as the standard deviation for this difference. We then determined how many standard deviations each state was above or below the average difference on each test.
| Shining a light on state standards is crucial—it helps remind state officials that there is a right way and a wrong way to ace a test. |
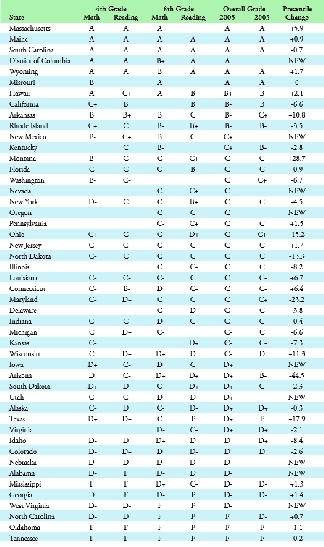
We gave each state the same kind of grade students receive: Where the requisite information was available, states with the highest standards were given an A; those with the lowest standards, an F. The scale for the grades was set so that, if grades had been randomly assigned, 10 percent of the states would earn As, 20 percent Bs, 40 percent Cs, 20 percent Ds, and 10 percent Fs. Each state's grade is based on how much easier it was to be labeled proficient on the state assessment as compared with the NAEP. For example, on the fourth-grade math test in 2005, South Carolina reported that 41 percent of its students had achieved proficiency but that only 36 percent were proficient on the NAEP. The difference (41 percent – 36 percent = 5 percent) is about 1.4 standard deviations better than the average difference between the state test and the NAEP (31 percent), good enough for South Carolina to earn an A for its fourth-grade math standards. The overall grade for each state was determined by taking the average of the standard deviations on the tests for which the state reported proficiency percentages.
Truth in Advertising
For 2003, the requisite data were available for only 40 states. For 2005, 48 states have been graded, including nine new states providing the necessary information for the first time. That these nine are now in compliance with NCLB is a laudable accomplishment, but it is not clear how committed they are to the enterprise: of the nine, only the District of Columbia and New Mexico scored grades higher than C, and Utah, Iowa, Oregon, and Nevada could do no better than a C or D. The first grades garnered by Alabama, Nebraska, and West Virginia were D minuses.
| Student proficiency clearly has entirely different meanings in different parts of the country. |
Meanwhile, five states that had had their accountability systems in place are beginning to let their standards slide. The biggest decline was in Arizona, with significant drops also found (in order of magnitude) in Maryland, Ohio, North Dakota, and Idaho. If parents in these states read that students are making great strides on state proficiency tests, they should consider the message with a healthy dose of skepticism. At least some of the reported student gains appear to be the product of gamesmanship.
In addition, states with already low standards have done nothing to raise them. Oklahoma and Tennessee once again share the Cream Puff Award, with both states earning Fs because their self-reported performance is much higher than can be justified by the NAEP results. States with nearly equally embarrassing D minuses included Mississippi, Georgia, and North Carolina. Once again, we discover that Suzy could be a good reader in North Carolina, where standards are low, but a failure in neighboring South Carolina, where standards are higher.
Still, there are happier stories to tell. Montana is the most improved state. Others that have significantly boosted their proficiency standards relative to the NAEP include Texas, Arkansas, and Wisconsin.
Best of all, a handful of states continued to impress, grading their own performance on a particularly tough curve. Massachusetts, South Carolina, Wyoming, Maine, and Missouri all once again earned As, along with newcomer Washington, D.C.
| Oklahoma and Tennessee once again share the Cream Puff Award because their self-reported performance is much higher than can be justified by their national assessment scores. |
Shining a light on the standards that states set is crucial, as it helps remind state officials that there is a right way and a wrong way to ace a test. Of course, having high standards is the crucial first step; the next, and more difficult, one is making sure that a high percentage of students reach that standard. In that regard, all states need to do much better if no child is to be left behind.
