- Politics, Institutions, and Public Opinion
Last week, I looked back at one of the important U.S. House votes on Social Security reform in 1983. In a graphic representation of the roll call, one thing that stands out is that the core of that successful legislative coalition was comprised of moderate members from both parties. Levels of support for the reform package dropped off substantially once you move outside the Center.
So in today’s Congress, where members are ideologically polarized and moderates are an endangered species, is it wishful thinking that you could round up the 218 votes in the House for a 1983-style, grand bargain of benefits reductions and tax increases? If enough members of the 112th House have ideological preferences that, in 1983 at least, were associated with the lowest rates of support for a grand bargain, House leaders and negotiators for Social Security reform in 2011 might be starting out way behind on the whip count.
I decided to do a little desk chair whip counting. And I now think that while, yes, political polarization has made it harder to build a majority for a grand bargain on Social Security, there are still plenty of votes for reform in the chamber today.
In a nutshell, I projected how many House members today would vote for a 1983-esque package of Social Security reforms by using the rates at which their ideological brethren from the 98th House supported the reforms. You can read a summary of the 1983 reforms here. (After conference committee, the Senate agreed to adopt the Social Security Amendments, H.R. 1900, as passed by the House on the roll call that I use here.)
Yes, I’m assuming things here. The two most important assumptions are these: One is that it is possible to craft a compromise of tax increases and benefits reductions today that would have the same ideological flavor as the 1983 reform package. (I think this is a reasonable assumption.) The second is that members are not making political calculations today that are so different from the ones members were making in 1983 that those considerations would significantly change their likelihood of voting for the bill, independent of their ideology. (This assumption is much bolder than the first, I know.) But bear with me. This is a rough cut to be sure, but it gives us something to talk about and work from.
Here’s what I did to come up with a number:
How I got a bead on the 87 House freshmen
For political ideology scores, I turned to the kind folks at <Voteview.com>, who calculate, refine, and share their estimates of senators’ and House members’ scores on a liberal-conservative scale of ideology about government intervention in the economy. These scores are widely used by political scientists. I used their estimates (called DW-NOMINATE scores) for the earlier post on the 1983 Social Security roll call, and I use those same scores for the 98th House members here as well. For the members of the relatively new 112th Congress, the scholars at Voteview.com estimated the political ideology of returning House members by using the scores they had at the end of the 111th House. For the House freshmen, they forecast scores based on each member’s political party, the 2008 GOP presidential vote percentage in the member’s district, and a measure of the ideological leanings of the member’s district based on constituent responses to a major survey, the 2008 Cooperative Congressional Election Study (CCES).
The Math
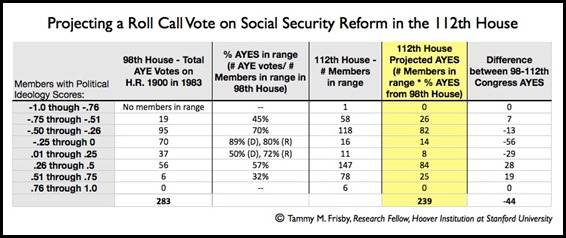
Next, I grouped members by 0.25 increments on the liberal-conservative scale. I chose 0.25 because there was a pronounced difference in the rates at which members inside and outside of the -0.25 and 0.25 markers supported the 1983 reforms. You can see my earlier post for the visual evidence of that. I then calculated the percentage of members in each group that voted "aye” on H.R. 1900 in 1983, and then applied that rate of support to the same ideological grouping in the current House (e.g., # of 112th House members in range -0.5 to -0.26 * % AYE among 98th Housemembers with ideology scores between -0.5 and -0.26). In the table below, you can follow along with the calculations for each grouping. For the middle ranges, where you used to find members of both parties, I use the percentage for the party of the members that now exclusively occupy that range (Democratic percentage for the -0.26 to 0 range, Republican percentage for the 0.01 to .25 range).
(click the chart to see a larger version)
My Whip Count
The upshot is that, yes, the polarization of Congress has probably cut into the number of “ayes” we'd be likely to see on a vote on some grand bargain for Social Security reform under divided government, when both Republicans and Democrats must be appeased to get to a deal. Members on the far(ther) right will be reluctant to go on record in support of any tax increases. Members on the far(ther) left will be unwilling to vote in favor of benefits reductions. I project that there are 44 fewer votes for such a deal today than when the House voted on the Social Security Amendments (H.R. 1900) in 1983 (see the last column in the table for the differences in each ideological range).
The flip side of this, of course, is that there could be 239 votes for a Social Security deal if it could be brought to the House floor with both the White House and the Republican leadership firmly behind the deal.
Much stands between now and such a roll call vote in the 112th House. But I think there’s a latent legislative majority in the House in favor of a 1983-style Social Security reform package.


