


Everyone now seems to agree that the exploding federal debt is a serious problem that must be addressed. But how? The following two charts provide some data to help answer that question. I put the charts together using budget data from CBO’s new Long Term Budget Outlook released on June 30. They take account of the budget effect of latest legislation—including the Obamacare bill.
The first chart presents the outlook for spending (red line) and revenue (blue line) as a share of GDP using CBO’s “alternative scenario,” which assumes that President Obama’s tax increase proposal is passed, including increasing the two top income tax rates. The deficit is the difference between the red and blue lines. Thus the chart clearly demonstrates that the deficit is exploding because government spending is exploding. 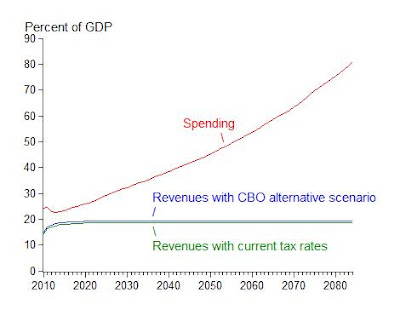
The chart also shows (green line) what would happen to tax revenue if tax rates stay at their current level and are not increased as President Obama has proposed. Taxes would average about 18.5 percent of GDP compared with 19.3 percent for CBO’s estimate under the Obama tax rate increase. According to the chart the Obama tax increase would not have a material effect on the very large deficit (the chart even overstates the effect because it assumes static budget scoring). Again the problem is spending growth, not taxes. To me this chart implies that it is far better to leave tax rates where they are and focus on a plan to end the explosive spending growth, especially in a weak economic environment where higher marginal tax rates can severely reduce economic growth and employment.

-
About Hoover
About Hoover
Located on the campus of Stanford University and in Washington, DC, the Hoover Institution is the nation’s preeminent research center dedicated to generating policy ideas that promote economic prosperity, national security, and democratic governance.
Learn More
-
Fellows
Fellows
Hoover scholars form the Institution’s core and create breakthrough ideas aligned with our mission and ideals. What sets Hoover apart from all other policy organizations is its status as a center of scholarly excellence, its locus as a forum of scholarly discussion of public policy, and its ability to bring the conclusions of this scholarship to a public audience.
View All Fellows
-
Research
Research
Throughout our over one-hundred-year history, our work has directly led to policies that have produced greater freedom, democracy, and opportunity in the United States and the world.
Learn More
-
Commentary
Commentary
Hoover scholars offer analysis of current policy challenges and provide solutions on how America can advance freedom, peace, and prosperity.
Learn More - Library & Archives
- Support Hoover
- Events
- Student Opportunities
-
MyHoover

-
MyHoover
What is MyHoover?
MyHoover delivers a personalized experience at Hoover.org. In a few easy steps, create an account and receive the most recent analysis from Hoover fellows tailored to your specific policy interests.
Watch this video for an overview of MyHoover.
Create AccountForgot Password
Login?
-
MyHoover
-
MyHoover
What is MyHoover?
MyHoover delivers a personalized experience at Hoover.org. In a few easy steps, create an account and receive the most recent analysis from Hoover fellows tailored to your specific policy interests.
Watch this video for an overview of MyHoover.
Create AccountHave questions? Contact us
Forgot Password
Login?
-
Support Hoover
Support Hoover
Learn more about joining the community of supporters and scholars working together to advance Hoover’s mission and values.
Learn More

