


- Economics
- Law & Policy
- Regulation & Property Rights
The u.s. economy hit bottom in June 2009. Thirty months later, output growth remains sluggish and unemployment still hovers above 8 percent. A critical question is why. One view attributes the weak recovery, at least in part, to high levels of uncertainty about economic policy. This view entails two claims: First, that economic policy uncertainty has been unusually high in recent years. Second, that high levels of economic policy uncertainty caused households and businesses to hold back significantly on spending, investment, and hiring. We take a look at both claims in this article.
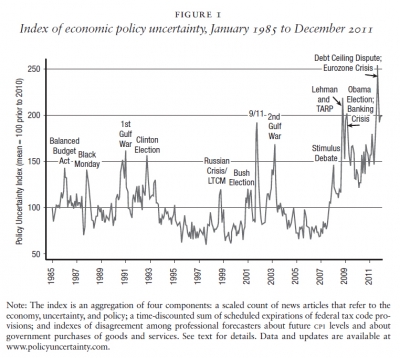
We start by considering an index of economic policy uncertainty developed in our 2012 paper “Measuring Economic Policy Uncertainty.” Figure 1, which plots our index, indicates that economic policy uncertainty fluctuates strongly over time. The index shows historically high levels of economic policy uncertainty in the last four years. It reached an all-time peak in August 2011.
As discussed below, we also find evidence that policy concerns account for an unusually high share of overall economic uncertainty in recent years. Moreover, short-term movements in overall economic uncertainty more closely track movements in policy-related uncertainty in the past decade than in earlier periods. In short, our analysis provides considerable support for the first claim of the policy uncertainty view.
The second claim is harder to assess because it raises the difficult issue of identifying a causal relationship. We do not provide a definitive analysis of the second claim. We find evidence that increases in economic policy uncertainty foreshadow declines in output, employment, and investment. While we cannot say that economic policy uncertainty necessarily causes these negative developments — since many factors move together in the economy — we can say with some confidence that high levels of policy uncertainty are associated with weaker growth prospects.
Economic policy uncertainty over time
Figure 1 plots our monthly index of economic policy uncertainty from January 1985 to December 2011. Before describing the construction of the index, we briefly consider its evolution over time. The policy uncertainty index shows pronounced spikes associated with the Balanced Budget Act of 1985, other major policy developments, the Gulf Wars, the 9 / 11 terrorist attack, financial scares and crises, and consequential national elections. Policy uncertainty shoots upward around these events, and typically falls back down within a few months. The experience since January 2008 is distinctive, however, in that policy uncertainty rose sharply and stayed at high levels. The last two years are especially noteworthy in this respect. While the most threatening aspects of the financial crisis were contained by the middle of 2009, the policy uncertainty index stood at high levels throughout 2010 and 2011.
The index shows a sharp spike in January 2008, which saw two large, surprise interest rate cuts. The Economic Stimulus Act of 2008, signed into law on February 13, 2008, was also a major focus of economic policy concerns in January 2008. The policy uncertainty index jumps to yet higher levels with the collapse of Lehman Brothers on September 15, 2008, and the enactment in early October of the Emergency Economic Stabilization Act, which created the Troubled Asset Relief Program (tarp). A series of later developments and policy fights — including the debt-ceiling dispute between Republicans and Democrats in the summer of 2011, and ongoing banking and sovereign debt crises in the Eurozone area — kept economic policy uncertainty at very high levels throughout 2011.
So how do we construct our index? We build several index components and then aggregate over the components to obtain the index displayed in Figure 1. Interested readers can consult our 2012 paper for more details.
Newsbased component. Our first index component quantifies newspaper coverage of policy-related economic uncertainty. Basically, we measure the monthly frequency of newspaper articles that contain terms related to the economy, uncertainty, and policy. The idea is that a greater number of news articles about economic policy uncertainty reflects the fact that households and businesses are facing a higher level of economic policy uncertainty. This news-based proxy for the level of policy uncertainty is by no means perfect, but we think it provides a useful indicator.
How exactly do we proceed? We consider ten newspapers: Wall Street Journal, New York Times, Washington Post, usa Today, Chicago Tribune, Boston Globe, San Francisco Chronicle, Los Angeles Times, Miami Herald, and Dallas Morning News. We conduct an automated search of all articles in each newspaper from January 1985 to December 2011. For each newspaper, we obtain a count for the number or articles that contain three sets of terms. The first set is {economy, economic}, the second is {uncertain, uncertainty}, and the third is {policy, regulation, Federal Reserve, tax, spending, budget, deficit}. To make it into our count, an article must contain at least one word from all three sets. These search criteria would, for example, flag an article from the New York Times that contains the words “economic,” “uncertainty,” and “tax.”
Of course, the raw count of articles that satisfy our search criteria might be influenced by changes over time in the length or total number of articles. So, rather than use the raw monthly count of articles that meet the search criteria, we scale by the number of articles in the same paper containing the word “today.” Finally, we combine the scaled count for the ten individual newspapers to form our monthly news-based index of economic policy uncertainty.1
As a robustness check, we applied the same approach to a news-based index of economic policy uncertainty using Google News, which covers hundreds of newspapers and online news sources. The correlation between our Google News index of economic policy uncertainty and our ten-paper index is 0.76 in the monthly data. We use the ten-paper index as a component of our overall index, because the underlying sources for Google News vary over time in ways that we cannot directly observe or control. Nevertheless, the broader coverage of Google News is quite useful for some purposes, and our work in our earlier paper exploits both the ten-paper approach and the Google News approach.
We also conducted several cross-checks to evaluate the news-based approach. One check uses the news-based approach to construct an index of uncertainty about stock prices. Specifically, we use automated searches to obtain a (scaled) count for the number of news articles with at least one term from all three of the following sets: {economy, economic}, {uncertain, uncertainty}, and {“stock market,” “stock price,” “equity price”}. We compare this news-based index of stock market uncertainty to the vix — the Chicago Board of Options Exchange Index of implied volatility in the s&p 500 stock price index. The two indexes move closely together. That is, our news-based index of stock market uncertainty closely mirrors the leading index of stock market uncertainty based on asset prices. The success of the news-based approach at tracking movements in uncertainty about stock prices gives us confidence that the same approach can accurately track other aspects of economic uncertainty.
Scheduled tax code expirations. A second component of our overall index exploits data on federal tax code provisions that, as a matter of current law, are scheduled to expire at specified future dates. Many of these provisions are “temporary” tax measures that may or may not be extended, with Congress often waiting until the last minute and engaging in large political debates that cause uncertainty for the households and businesses affected by the provisions.
A recent example involves the federal government’s use of temporary payroll tax cuts. The Tax Relief, Unemployment Insurance Reauthorization, and Job Creation Act of 2010 instituted a temporary cut in the payroll tax rate, with expiration scheduled for December 31, 2011. The sluggish nature of the recovery in 2011 prompted many calls to extend the payroll tax cut for a second year. The possibility of an extension, and how to cover the revenue loss, became an increasingly contentious and partisan political issue as the expiration date drew nearer. After much back and forth, Congress finally approved an extension on December 23, 2011 — but only for two months. Then, just days before the tax cut’s expiration in late February, it was extended until the end of 2012, allowing Congress to wait until after the November 2012 elections to decide the fate of the policy.2 This type of legislative indecision and last-minute action undermines the stability of and certainty about the tax code.
To quantify the frequency and importance of scheduled tax code expirations, we rely on data from the Congressional Budget Office (cbo). Since 1991, the cbo produces annual reports that list federal tax code provisions set to expire over the next ten years. Using these data, we construct a discounted sum of future tax code expirations. This discounted sum serves as the tax code expiration component of our overall economic policy uncertainty index.
This index component shows rapid growth over the past decade in the discounted volume of scheduled tax code expirations. By 2011, the volume of tax code provisions set to expire is about five times larger than in the late nineties. Our paper also constructs another index of scheduled tax code provisions, using data from the Joint Congressional Committee on Taxation (jct), and obtains very similar results. The cbo, and presumably the jct, did not produce data on scheduled tax code expirations before 1991 because the volume was too small to matter. In short, the evidence on scheduled tax code expirations indicates that the federal tax system has become an increasingly important source of uncertainty for businesses and households.
Forecaster disagreement about inflation and government purchases. For the third set of components in our policy uncertainty index, we consider disagreement among economic forecasters. We get data from the Federal Reserve Bank of Philadelphia, which surveys about 50 professional forecasters every quarter. We look at how much the forecasters disagree on, first, the Consumer Price Index measure of quarterly inflation four quarters ahead and, second, on the level of government purchases of goods and services four quarters ahead. Larger forecast differences presumably indicate larger differences of opinion, which suggests more uncertainty about future developments than if forecasters mostly agree. Conversely, we take smaller forecast differences to indicate less uncertainty.
To measure disagreement about future inflation, we compute the interquartile range — the spread between the 75th and 25th percentiles — of the four-quarter-ahead forecasts for the quarterly inflation rate. For government purchases, we follow the survey and treat federal government purchases separately from state and local purchases. That is, we compute an interquartile spread measure for the four-quarter-ahead forecasts of federal government purchases, and we compute an analogous measure for state and local government purchases. We then sum the two measures, weighting by size of purchases, to obtain our index component for uncertainty about future government purchases of goods and services.3
The disagreement indexes point to relatively high levels of uncertainty about future inflation in the first six years of our sample period (i.e., from 1985 to 1991), during 2008 and early 2009, and again since late 2010. They also show a pattern of high and volatile uncertainty about future government purchases in the first eight years of our sample period and again since the fourth quarter of 2008. The recent increase in uncertainty about government purchases is more pronounced at the state and local level than the federal level.
Aggregating the components to obtain an index of economic policy uncertainty. To aggregate the components into our overall index of economic policy uncertainty, we give 50 percent weight to the news-based component, as it is the broadest measure, and equal weights to the scheduled tax code expiration component, the inflation disagreement component, and the government purchases disagreement component. All components show an increase in economic policy uncertainty in recent years, although to varying degrees. Because the index components share many similarities, the behavior of the overall index is not very sensitive to different weighting schemes.
Policy uncertainty and economic uncertainty
A useful feature of the news-based approach to measuring uncertainty is its flexibility. We exploit that flexibility to quantify the extent to which policy-related uncertainty accounts for overall economic uncertainty. We also use the news-based approach to uncover specific sources of policy uncertainty. For these exercises, we rely on data from Google News. The higher volume of news articles captured by Google News is especially useful when we slice the data into particular policy categories.
Figure 2 shows two indexes. The lower data line is our Google News-based index of economic policy uncertainty, constructed using the method we described above for the ten-paper index. The upper line is an analogous count of articles that mention the economy and uncertainty but may or may not mention policy. So, if a news article talks about the economy, uncertainty, and policy, it shows up in both indexes. If it talks about the economy and uncertainty but does not mention policy, it shows up only in the index given by the upper line.
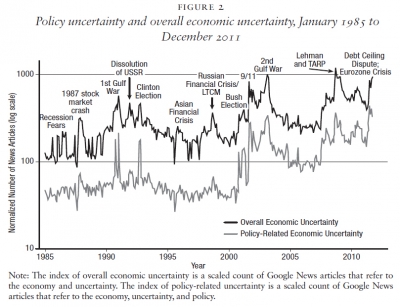
Comparing the two lines, we see that many articles from 1985 to 2000 mention economic uncertainty but don’t refer to policy. That’s the gap between the upper and lower lines. Certain episodes — recession fears in the second half of the 1980s, for example — generated a lot of talk about economic uncertainty but not much talk about policy.
Since 9 / 11, however, and especially from 2008 onwards, the two lines move together closely, and the gap between the lines is smaller (especially in proportional terms). So when news articles talk about economic uncertainty in recent years, they typically also discuss policy. Moreover, we found that the news-based index of economic uncertainty is more highly correlated with the news-based index of policy uncertainty in recent years than in the period before 9 / 11. These results support the view that policy-related concerns have become a more important source of economic uncertainty.
The obvious next question is: Which aspects of policy are the most important sources of economic uncertainty? In our paper, we drill into the details of the articles in Google News that meet our criteria for economic policy uncertainty. We use more refined search criteria to construct counts for twelve broad categories of economic policy such as monetary policy, taxes, health care, financial market regulation, labor market regulation, and so on.
Here’s a three-point summary of what we found:
- Monetary policy accounts for about one-third of policy-related economic uncertainty in the period from 1985 to 2011. Concerns related to taxes, government spending, and fiscal policy appear even more important, accounting for about 40 percent.
- The historically high levels of economic policy uncertainty in 2010 and 2011 predominantly reflect concerns about taxes and monetary policy. Policy uncertainty in these two areas is more than four times higher in the last two years than on average from 1985 to 2011, judging by frequency counts of news articles.
- Although much less pronounced, we also found elevated levels of policy uncertainty in 2010 and 2011 in several other categories: entitlement programs, health care, financial regulation, labor regulation, and sovereign debt and currency issues.
In short, our analysis indicates that the historically high levels of policy uncertainty in 2010 and 2011 mainly reflect concerns about tax and monetary policy and secondarily a broader range of other policy-related concerns.
We also approach the connection between economic uncertainty and policy in a different way by examining the sources of stock market volatility. We first identified all daily movements in the U.S. stock market by more than 2.5 percent, up or down, from 1980 to 2011. We then consulted the next day’s New York Times, which invariably contained a major article about the big move. Usually, the article offered a broad explanation for the move in the first paragraph. We reviewed these articles and, on that basis, allocated each big stock-market move into one of several categories such as news about corporate earnings, macroeconomic news, policy-related news, and so on.
Not surprisingly, we found a dramatic increase in the frequency of big daily stock market moves in the 2008–2011 period relative to the previous 28 years. More interestingly for present purposes, the number of big moves attributed to policy news skyrocketed from about one per year in the 1980–2007 period to twelve events per year from 2008 to 2011. The share of big moves attributed to policy rose to 39 percent in the past four years compared to 14 percent of a much smaller number in the earlier period. We see this evidence as strongly confirming the claim that policy uncertainty has been extraordinarily high in the past four years. Insofar as equity market volatility is harmful to the economy, this evidence also lends support to that claim that policy uncertainty has been a factor slowing the recovery.
Does policy uncertainty matter?
Given the evidence pointing to high policy uncertainty in recent years, it is natural to ask how much policy uncertainty matters for economic performance. At this point in our analysis, we must recognize that identifying causal relationships in macroeconomic data is very hard. What we can do is talk a bit about the theoretical connections between uncertainty and economic performance. We can also investigate empirically whether high levels of economic policy uncertainty are associated with weaker growth prospects.
In the theoretical realm, the economics literature has focused on three channels. The first is the real options effect. There is a long literature on this topic and, in fact, one of the best known and earliest pieces is a 1983 paper by Ben Bernanke titled “Irreversibility, Uncertainty and Business Cycles,” recently extended and quantified by “The Impact of Uncertainty Shocks,” (Bloom, 2009) and “Really Uncertain Business Cycles” (Bloom et al., 2012). The premise is that when firms are uncertain, it is expensive to invest or disinvest and to hire or fire. So uncertainty encourages firms to delay, more so for longer-lived investments and decisions that are costlier to reverse. The second channel is similar but works on the consumption side. Households become more likely to postpone spending when uncertainty is high, particularly on consumer durables like cars and major appliances — a key driver of the drop in demand during the Great Depression, as Christina Romer pointed out in her 1990 article “The Great Crash and the Onset of the Great Depression.” So high uncertainty encourages people to spend less and to build up a buffer stock of liquid assets.
A third channel involves financing costs. Higher uncertainty can raise the cost of capital, especially because much of policy uncertainty is macroeconomic in character and thus hard to diversify. Moreover, because many managers are not diversified in their wealth holdings — they often have explicit or implicit equity stakes in their employers — higher uncertainty encourages managers to adopt a cautious stance toward risk taking and investment, as Vasia Panousi and Dimitris Papanikolaou noted in 2011. As these brief remarks suggest, economic theory identifies reasons to suspect that high levels of policy uncertainty might undermine economic performance.
To approach the issue empirically, we have estimated vector auto-regressions (vars) that include measures of output, employment, prices, stock market levels, and interest rates. We regress current levels of these variable on their lagged values and look at what predicts what. Figure 3 summarizes one of our main results in the form of estimated dynamic relationships. The top graph displays the estimated path of industrial production following a shock to the policy uncertainty measure from Figure 1. Similarly, the bottom graph displays the estimated path for employment.
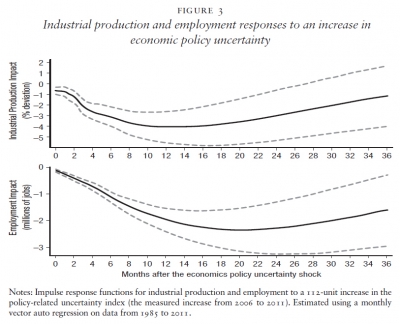
These graphs are predictions, based on an underlying statistical model, of what would happen over the subsequent three years if policy uncertainty increases by the amount of the actual change from 2006 to 2011. Because the underlying statistical model is linear, we can turn the graphs upside down to get the predicted increase in output and employment if current levels of policy uncertainty returned to 2006 levels. To be clear, we cannot say that the dynamic relationships displayed in Figure 3 are causal without invoking strong assumptions. But we can say that a return to 2006 levels of policy uncertainty, similar to the average level over our sample period, would appear to be good news for future employment and output growth.
Lubos Pastor and Pietro Veronesi identified, in their 2011 paper “Political Uncertainty and Risk Premia,” another potential negative aspect of policy uncertainty. They used our index to show that firm-level equity returns move together more closely when policy uncertainty is high, especially in the period since 2000. Greater co-movement in firm-level stock returns makes it harder for investors to diversify financial risks. That leaves investors with greater risk exposures and is likely to discourage risk taking, as discussed above. High levels of policy uncertainty probably lead to stronger co-movement of firm-level equity returns because much of the policy-related uncertainty is macroeconomic in nature.
Preliminary conclusions
This article summarizes our efforts to measure economic policy uncertainty and assess its effects on economic performance. Our research is ongoing, but we can draw a few preliminary conclusions at this point:
- Policy uncertainty has been at historically high levels over the past four years. This conclusion finds support in our new index of economic policy uncertainty and in our analysis of the factors that precipitate big movements in the stock market.
- Policy-related concerns now account for a large share of overall economic uncertainty. Here as well, this conclusion finds support in both the analysis of our news-based indexes and in our investigation into the factors that precipitate big stock market moves.
- A rise in policy uncertainty, similar in magnitude to the actual change since 2006, is associated with substantially lower levels of output and employment over the subsequent 36 months.
We think the weight of the evidence and the lessons of economic theory argue for assigning some weight to the policy uncertainty view. If policymakers can deliver a policy environment characterized by greater certainty and stability, there will likely be a positive payoff in the form of improved macroeconomic performance.
1 Specifically, we first scale each paper’s raw monthly count by a one-sided 36-month moving average of the “today” count in the same paper. We then normalize the scaled counts so that the time-series standard deviation is the same for all newspapers. Next, we sum the normalized scaled counts across newspapers by month to obtain our news-based index of economic policy uncertainty. As a final normalization, we divide the news-based index by its mean from January 1985 to December 2009 and multiply the result by 100.
2cbo’s “The Budget and Economic Outlook: Fiscal Years 2012 to 2022” contains some discussion of recent payroll tax cut provisions and their budgetary consequences. It’s available at http://www.cbo.gov/publication/42905 (accessed September 5, 2012).
3 Specifically, we compute the interquartile range of four-quarter-ahead forecasts of federal government purchases of goods and services, scaled by the median four-quarter ahead forecast of the same quantity. We then multiply by a five-year, backward-looking moving average for the ratio of nominal federal purchases to nominal gdp. These steps yield a sub-index of forecaster disagreement about federal government purchases. After obtaining an analogous sub-index of disagreement for state and local purchases, we sum the two sub-indexes, weighting by the relative size of their purchases.
