


- Politics, Institutions, and Public Opinion
As the midterm elections grow closer, there will be an avalanche of articles telling readers what will happen on November 6, 2018. Some pundits will point to the “generic congressional vote” as the key to understanding and predicting elections. The generic vote question has two focuses: One is asking which party’s candidate (without specific names) a respondent would vote for; the second is which party the respondent wants to control the next Congress. The generic ballot is a reasonable predictor as the actual election approaches, but the further away from the elections you are, the more inaccurate it is. Moreover, even the final estimates can be wrong, as they were in 1994 and 1998 when the generic vote among likely voters favored Democrats, who lost both elections. On the whole, the generic vote is useful the closer you get to the election.
The approval of the President is another measure that is frequently used to predict off-year House election results. Table I shows seat loss and presidential approval for midterm elections from 1986 through 2014. It is clear from the Table that having an approval rating above 50 percent limits midterm losses. In 1998 and 2002, Clinton and Bush were over 60 percent approval, and their parties gained 5 and 6 seats respectively, whereas Reagan and Bush, in 1986 and 1990, with high approval ratings kept their losses to under 10 seats.
In all cases where the presidents’ popularity is below 50 percent, their party suffered major losses. Clinton in 1994 and Obama in 2010 were at 46 and 45 percent approval and both lost control of the House, with Clinton losing 53 seats and Obama losing 63 seats. Bush II was at 38 percent in 2006 due to the Iraq war and the failed privatization of social security, and his party also lost control of the House to the Democrats, who picked up 30 seats. In 2014, Obama had a low rating, and Democrats lost 13 seats.
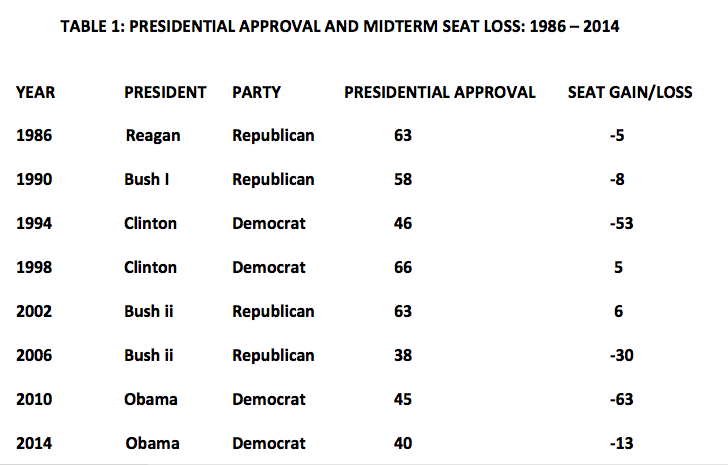
There is a linear relationship between approval and seat losses, but it is not absolutely clear, as shown by Obama’s loss of 63 seats in 2010 with a 45 percent approval, and a 13-seat loss in 2014 with a 40 percent approval. In sum, while presidential approval is clearly related to seat losses, it depends upon the circumstances of the individual election, such as whether the president’s party is in the majority or the minority.
A third measure often used to assess the midterms is the state of the economy. This measure has been shown to be much less influential in determining results than presidential approval. Three examples illustrate this point. In 1994, after Clinton made his State of the Union address, the U.S. economy was growing at over 4 percent, with 316,000 jobs added in January of that year. The economy continued to be in good shape through the 1994 elections, when his party lost control of Congress for the first time in 40 years. In 1990 and 2002, the Bushes presided over slow-growth economies and yet both did well in the midterm elections, with Bush senior losing only 8 seats and Bush II gaining six seats. Thus, although it is better to have a good economy, it turns out that the presidential job-approval variable (which is correlated with the economy) is a better predictor.
Why is it that these variables don’t better predict midterm election results? There are several reasons, the main one being that it is hard to predict turnout across individual congressional districts. Another reason is that the famous personal vote for members of Congress (or the incumbency advantage) has all but disappeared over the last twenty years, falling from about 8.5 percent in the 1990s to less than 2 percent today. That is, in the past, incumbent members of Congress could expect about an 8 percent boost because they were incumbents, while today that has fallen to 2 percent. This means that today’s voters do not split their ticket as they once did to favor incumbents.
Predicting turnout is like measuring voter enthusiasm. Thus, when Obama and Clinton lost their Democratic majorities, it was clear in retrospect that Republicans had been energized, organized, and turned out to vote, bringing Independent voters along with them. When Bush II lost his congressional majority in 2006, afterward it was clear that Democrats had been energized against the Iraq war and had organized, turned out, and brought along Independents with them. Why can’t we predict this accurately beforehand? We try, with questions asking how sure are you to vote in the upcoming election or how interested in the election are you—and, to a certain extent, the answers provide clues about what will happen in the election. But no normal survey size can get the numbers needed across 435 districts.
Another problem with predicting turnout is that if there are just House elections in a state where there are no interesting races for Governor or Senator, turnout does not rise for these elections. If a state has an interesting, competitive election for Governor and/or for Senator, then turnout rises and results change. So, again, we have indicators that are useful but not entirely satisfactory.
If none of these measures or a combination of them is entirely accurate, then how should one look at the forthcoming 2018 midterms? Because the Republicans are the majority party, this analysis focuses on their chance of keeping a majority. First, it should be noted that the Republicans will not lose as many seats in a wave election as Democrats did in 1994 and 2006. This is because Democratic voters are younger, urban, minority, and tend to be concentrated in districts where the electoral margins are not competitive. In the 2016 election, Trump lost the national popular vote by 2.1 percent, but Republicans won the median House seat by 3.4 points, meaning Democratic seats waste votes. Another way to think about this is that in 2012, Obama won by about 5 million votes, but Romney outpolled Obama in 226 congressional districts. Regular Republican voters are spread more evenly across suburbs, smaller cities, and rural places. Thus, Republicans waste fewer votes in “skewed districts,” i.e. the reverse of the Democrats
The real question for the 2018 elections is whether the Republicans will lose the House in a wave election. My argument so far has been that there are useful indicators for predicting election results but none are completely successful. Therefore, Table 2 looks at presidential approval, the generic ballot, economic growth, enthusiasm, and Independent voters in May preceding the wave elections of 1994, 2006, and 2010 and compares them to the same numbers for May 2018.
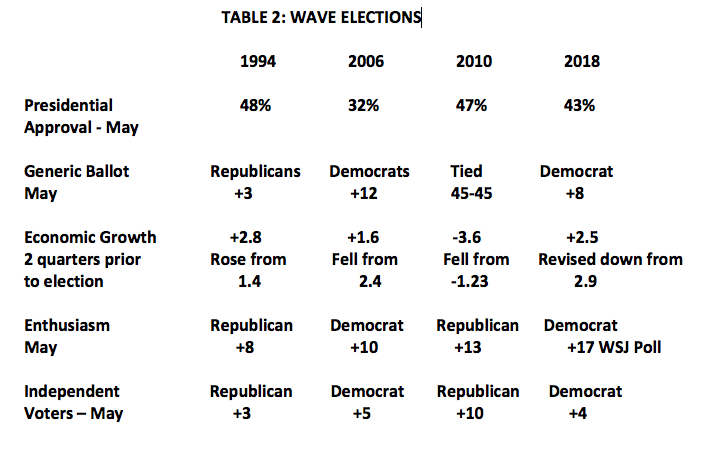
President Trump’s approval rating is higher than George W. Bush’s in May of 2006 but lower than both Clinton and Obama’s in 2010. On the generic ballot, again, only in 2006 did the President’s party look at a more formidable deficit in the results—12 to minus-8. In 2010 and 1994, the results in May were much tighter, even and -3 points, proving that much can happen between May and the election.
The party-enthusiasm variable is measured by asking respondents, “Would you say you are enthusiastic or not enthusiastic about voting in this year’s congressional elections? (If enthusiastic) are you very or somewhat enthusiastic?” On this measure, according to several recent polls, including a Wall Street Journal poll, the highest enthusiasm gap in the table is the 17 points in May 2018. In the 1994 and 2010 Republican wave elections, the enthusiasm gap in May was 8 percent in 1994 and 13 percent in 2010. Independent voters in May for each of these elections were tending toward the winning party, with 2010 showing the greatest gap and all the others at 3 to 5 percent. The best variable that Republicans have going for them is that the economy is strong, but, as stated earlier, it is the weakest predictor. Consider Clinton in 1994 with economic growth doubling from the previous year (1.4 to 2.8). Yet due to healthcare and other issues, his party lost control of the House for the first time in 40 years.
Given all these signs of a wave election, can it definitely be said that the Republicans will lose the House? The answer is no: it’s still too early to predict, because most state primaries have not yet occurred. By the end of May, only ten states will have determined who is going to run against whom. There are various counts of the number of districts that could switch from Republican to Democrat, ranging from pollster Larry Sabato’s 23 toss ups to RealClearPolitics’s 25, to the Cook Political Report’s 30 Republican toss-up seats.
Analyses of previous wave elections show that there are more seats at stake than one might suspect. In the 2006 Democratic takeover, 22 Republican incumbents lost the contest and, in sixteen of the races, the incumbent won in 2004 by anywhere from 15 points to 100 points. In short, depending on who is nominated to run against whom, it is too early to say which races will generate turnout and too early to say, as Chris Matthews did recently, that “Democrats will take back the House in 2018.” However, at this time, the signs, such as they are, point to big Democratic gains in the House, ceteris paribus.
