


- Politics, Institutions, and Public Opinion
- State & Local
- California
It may seem easy to dismiss capital gains taxes as just a “rich person’s problem.” Popular wisdom holds the wealthiest among us generate essentially excess wealth largely through well-timed investment trades, making capital gains nothing more than icing on their income cakes. Thus in a climate that has zeroed in on income gaps between the higher- and lower-wealth individuals, capital gains became rich targets in progressive tax systems.
However, when we consider the incredibly volatile nature of capital gains and their prominence within California’s boom-and-bust budgeting cycle, it becomes clear that capital gains taxes are actually everyone’s problem.
Today, California’s budget relies much more heavily on personal income than it did several decades ago. In 1970, personal income accounted for 23 percent of total state revenue. At the time, that was the second largest source behind sales tax revenue, but it was also balanced by the corporate tax, motor vehicle fuel tax, vehicle fees, and other taxes. However, personal income now accounts for 54 percent of total revenue alone, meaning the budget is essentially beholden to personal income’s variance around economic cycles.
But the more frightening reality is that the budget is truly beholden to capital markets. Unlike most states, California treats capital gains as personal income. This means the state taxes capital gains at the same rate it taxes personal income. It also means that particularly high capital gains one year may place an individual or couple in a higher tax bracket that year, or that particularly low gains may place them in a lower bracket. At California’s highest tax bracket, this means both traditional and capital gains personal income are taxed at a rate of 13.3 percent, the nation’s highest rate.
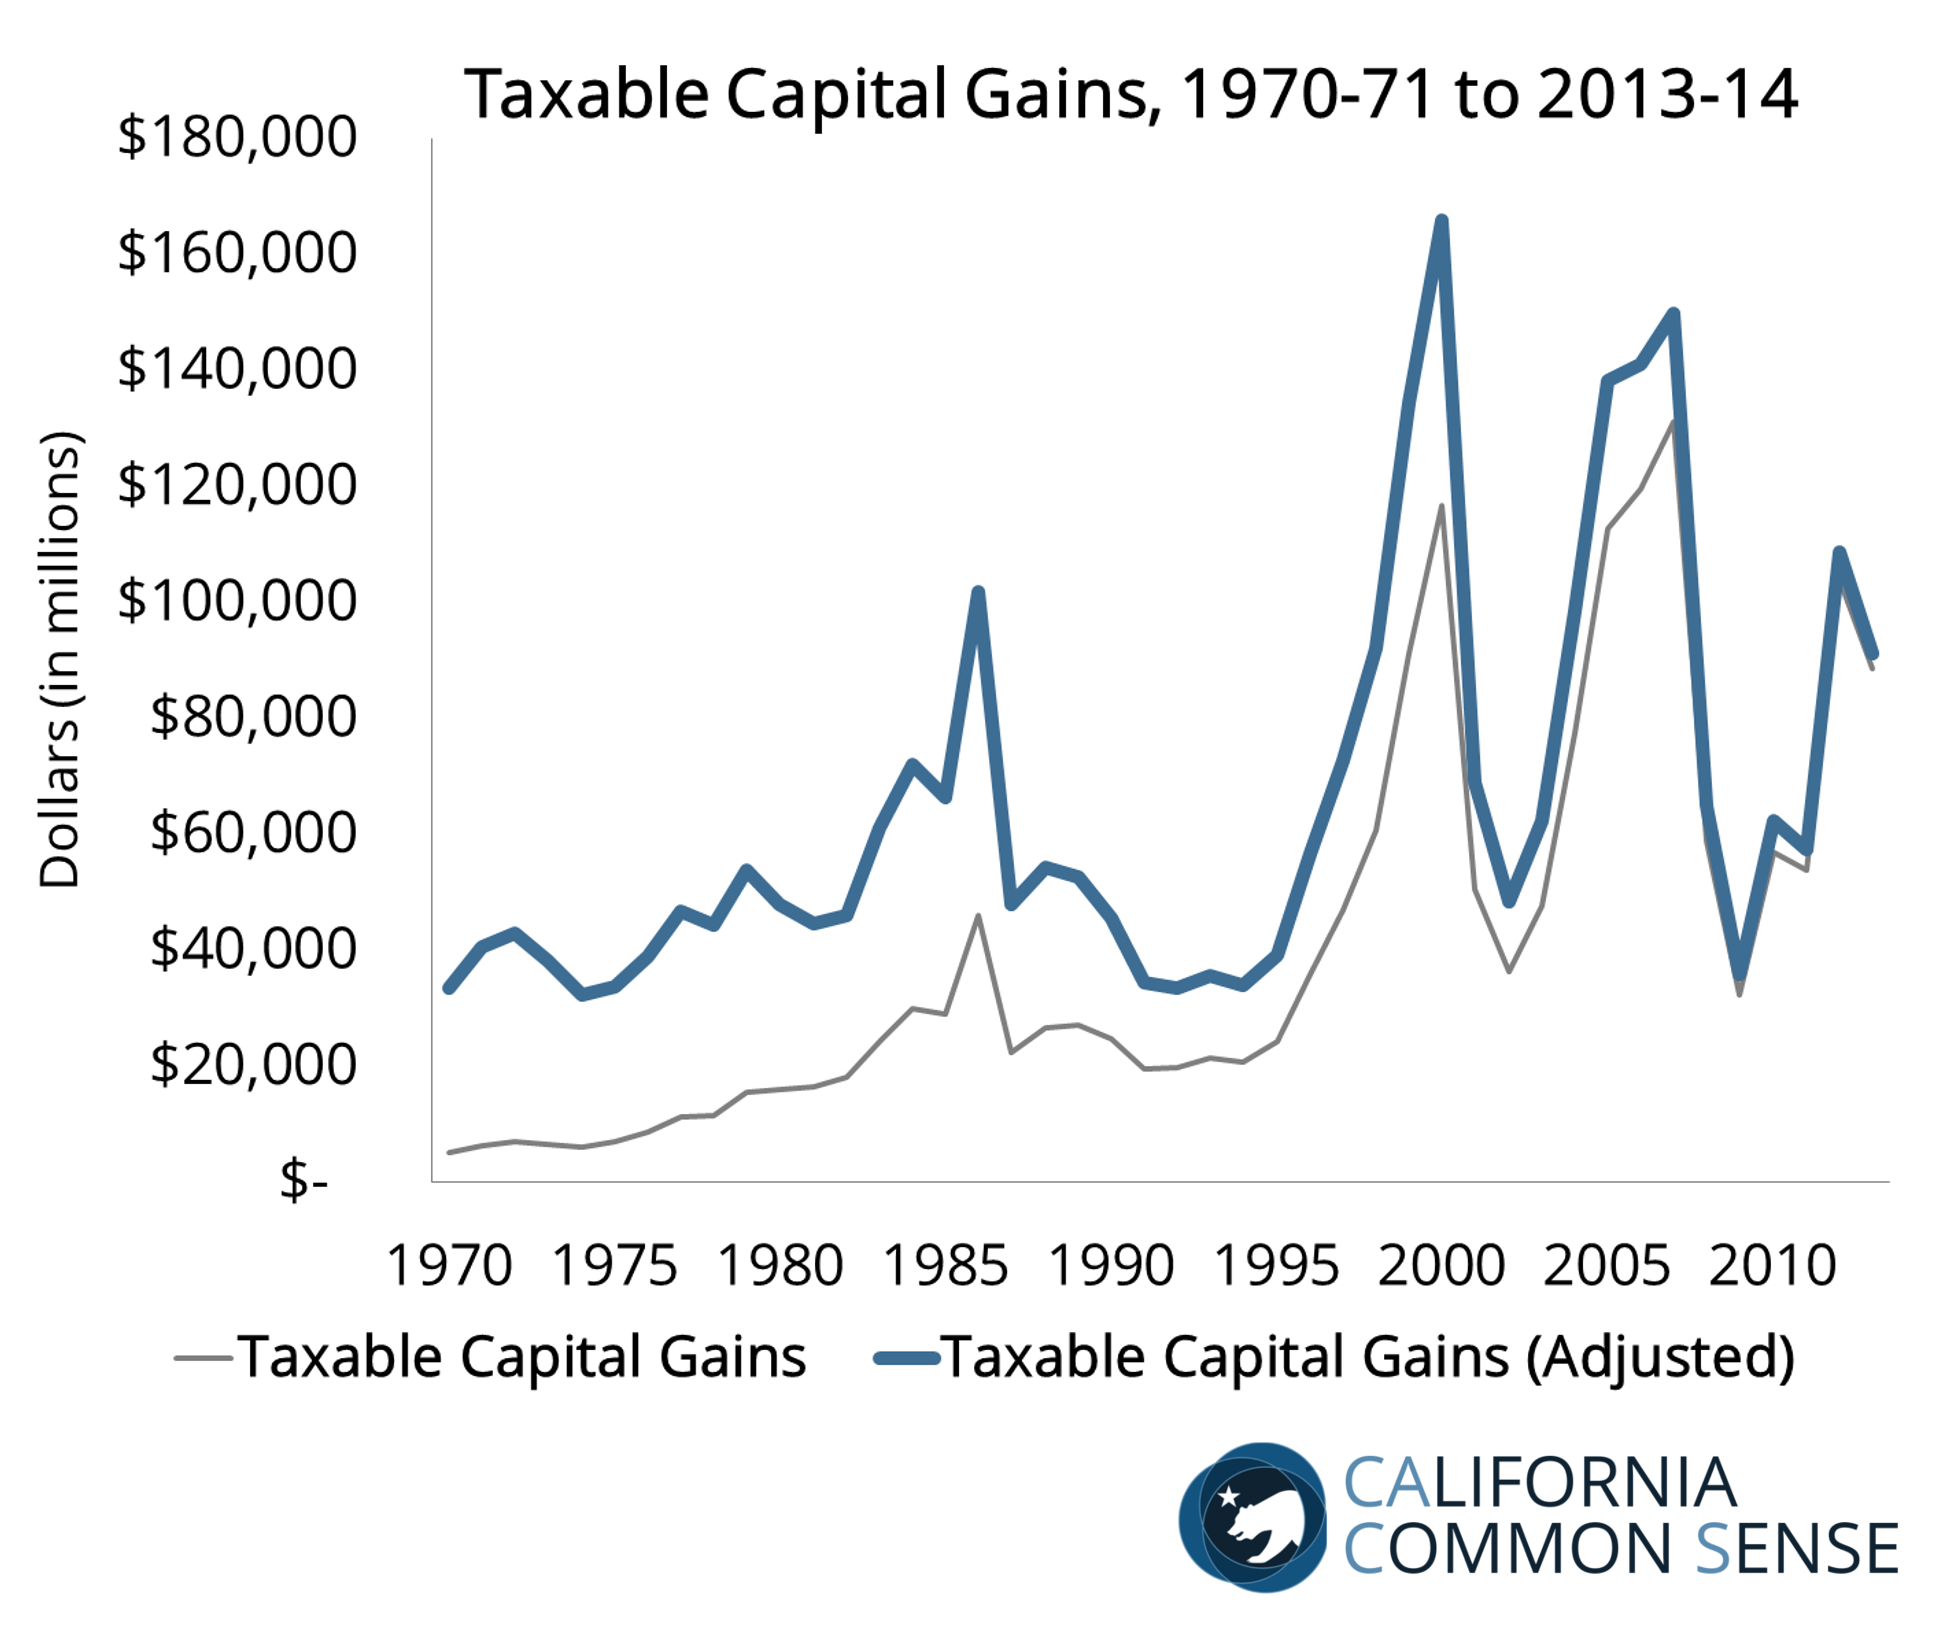
Traditional personal income is a volatile revenue sources as it declines significantly during economic downturns as unemployment rises. But capital gains are extremely volatile as they vary with investor behavior and market performance, in addition to economic cycles. Their proportion of personal income revenue does not remain steady over the course of economic cycles. Rather their proportion spikes in growth years and plummets in contraction years.
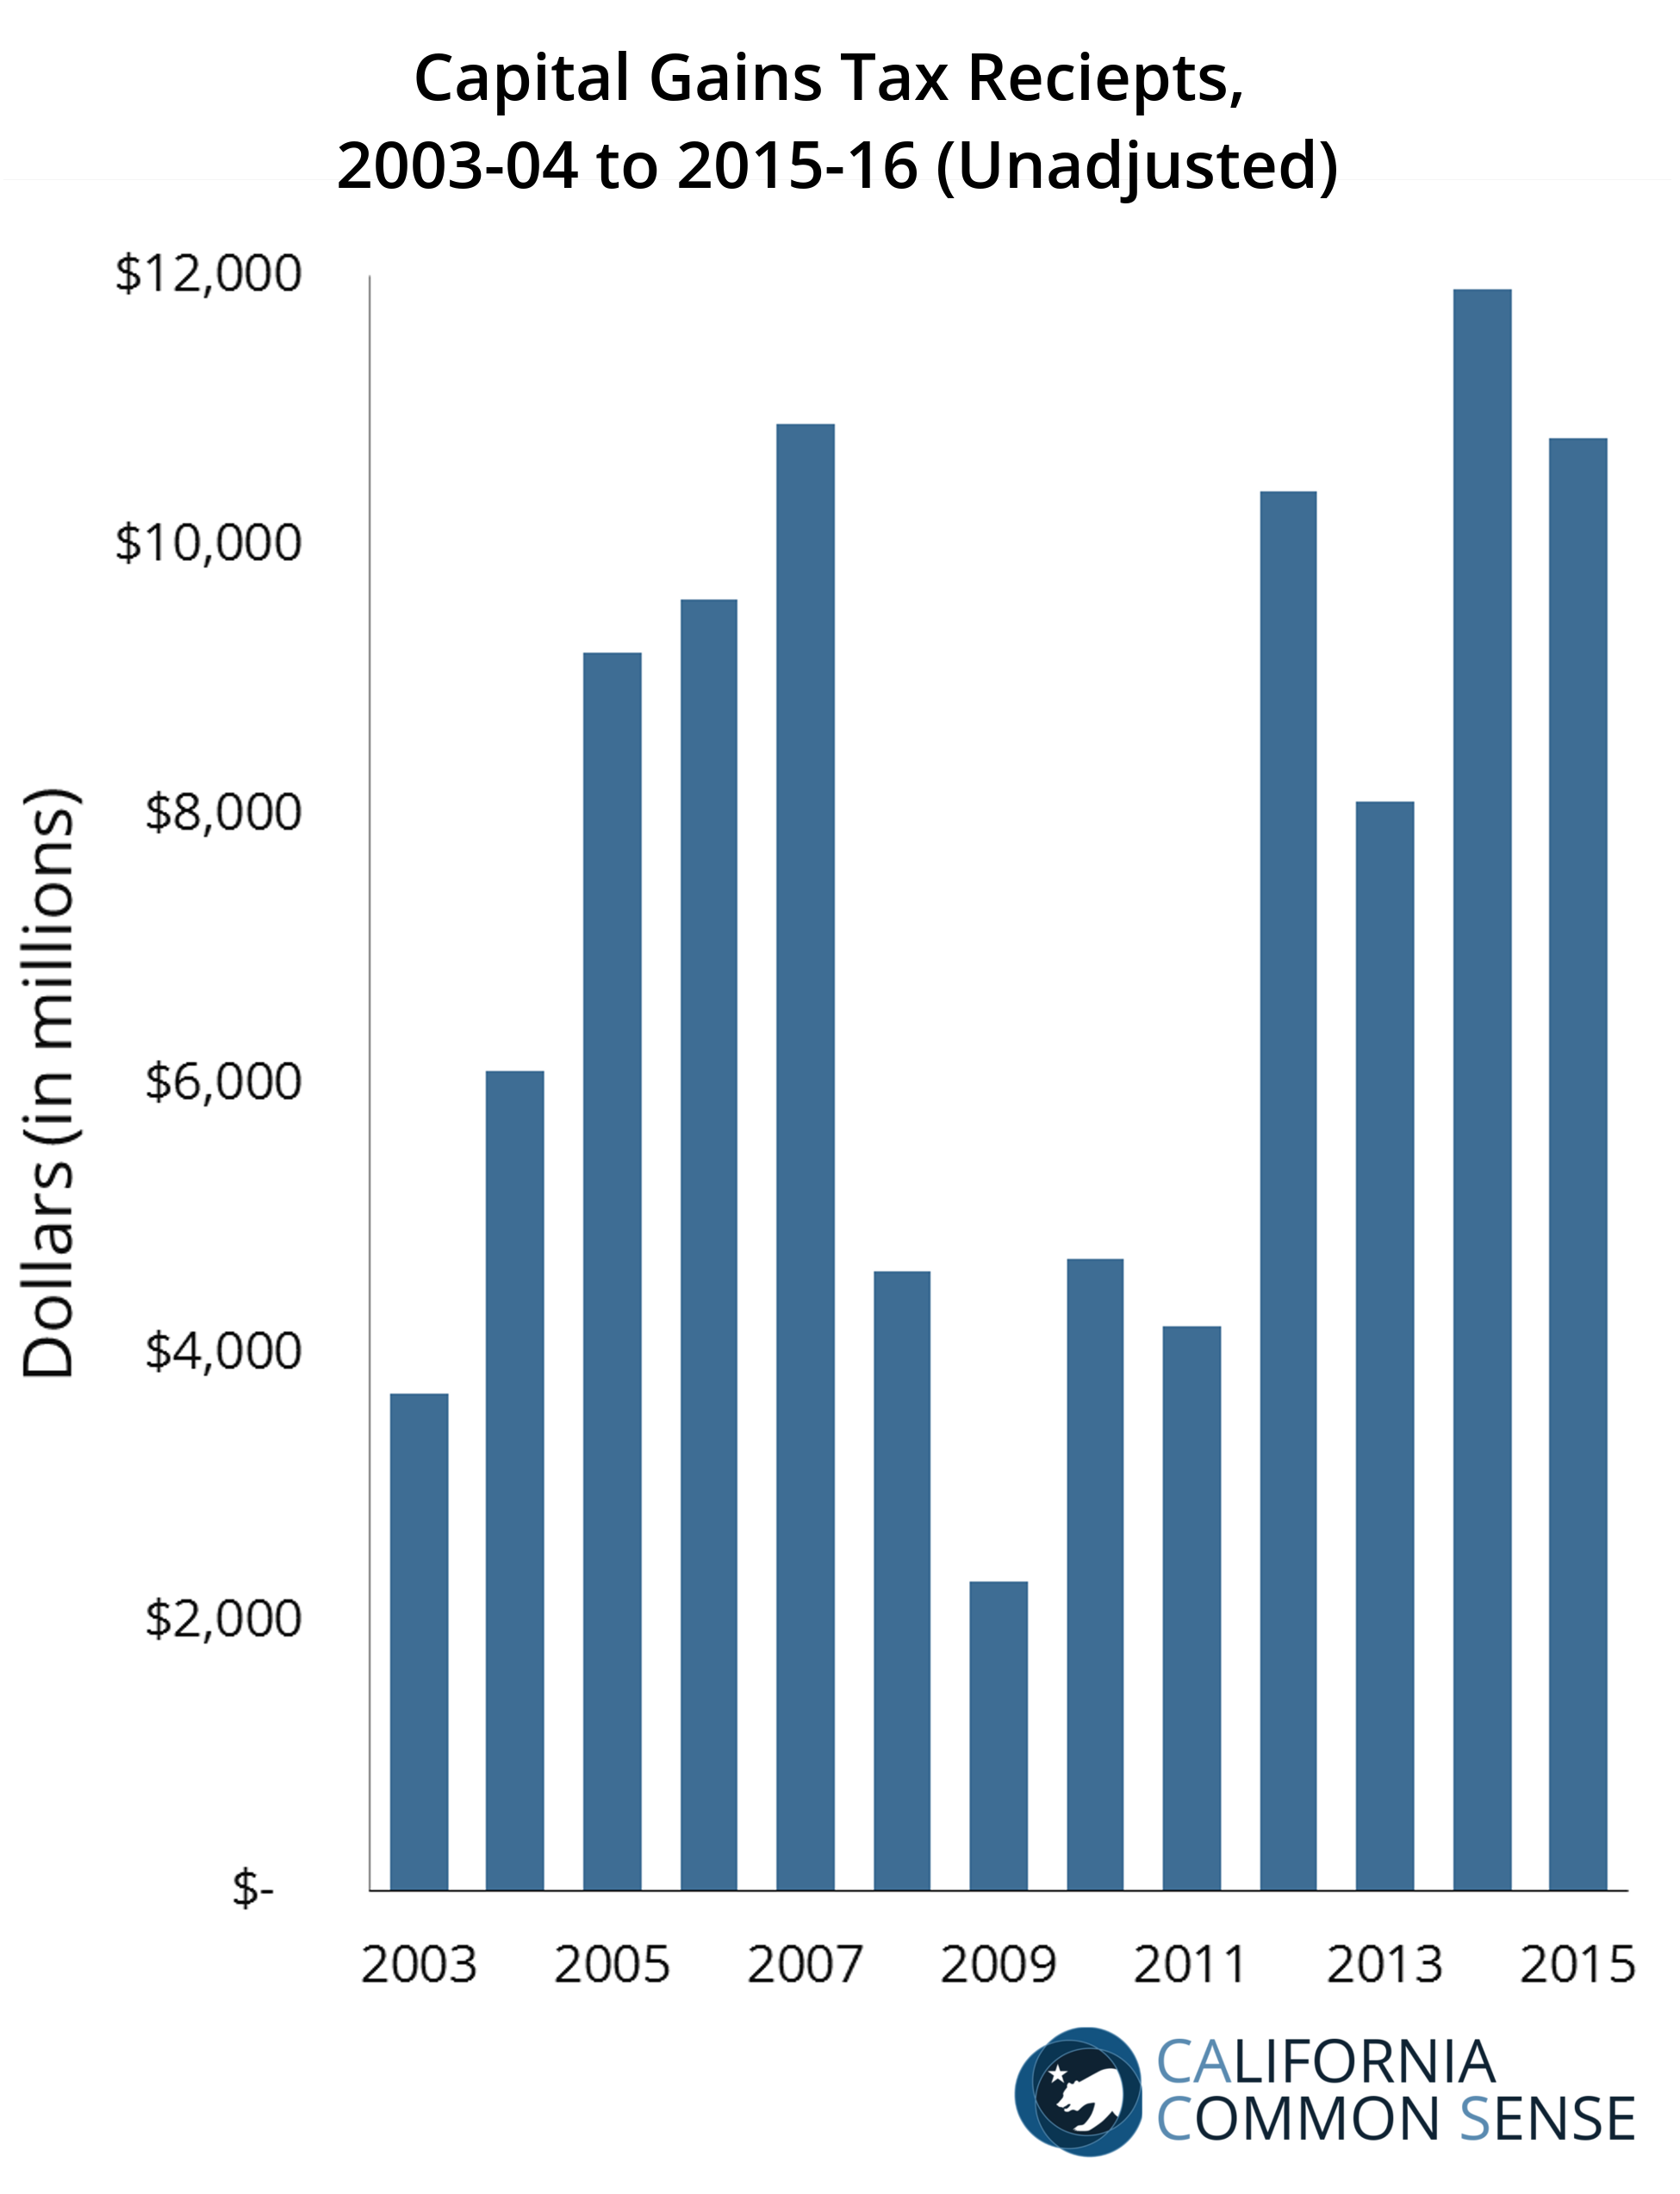
For instance, since 2003-2004, capital gains taxes have accounted for an average 13 percent of all state personal income tax revenue. But they accounted for as much as 20 percent in 2007-2008 ($10.9 billion) and as little as 5 percent in 2009-2010 ($2.3 billion).
Separated by only one fiscal year, these pre-crash spike and post-crash plummet years presented the public with some of the starkest realities of boom-and-bust budgeting. In 2007-2008, the state’s General Fund spending was at its highest at the time, $103 billion. That was a 7.5 percent increase over the previous year. When markets crashed in 2008, capital gains tax revenue was more than halved to $4.6 billion in 2008-2009 and was halved again to $2.3 billion in 2009-2010.
The $8.6 billion decline in capital gains tax revenue levels between 2007-2008 and 2009-2010 was the equivalent of losing nearly a tenth of previous General Funds. During the period, actual General Fund spending declined $15.8 billion, meaning capital gains losses accounted for more than half of the expenditure cuts.
Too often, we wrongly reduce the capital gains tax debate to a simple question of capacity. To what extent can we tax the uber-wealthy few? But given that California’s budget now routinely relies heavily on capital gains taxes, the better question is to what extent are we balancing the entire budget on just a few?
Two key revenue trends have coincided with Proposition 30’s passage in 2012. First, personal income consistently and firmly comprises the majority of state revenue. Second, in 2014-2015, $11.9 billion in generated revenue counted for its greatest share (17 percent) of personal income tax revenue post-Great-Recession. Together, this means that for the first time capital gains comprises this large of a share of personal income as personal income shoulders the bulk of the budget. The state’s budget – its ability to provide public services, maintain infrastructure, educate students – are at an even greater risk due to the compounded risk of volatility.
To be fair, Proposition 2 (2014) did strengthen California’s Rainy Day Fund to some extent. It mandated that the state set aside 1.5 percent of the General Fund and capital gains revenue in excess of 8 percent of the General Fund (until the Rainy Day Fund is equivalent to 10 percent of the General Fund). Since 2003-04, this would have meant the state would have set aside excess capital gains revenue in six fiscal years at an average $2.3 billion.
However, under Proposition 2, the Rainy Day Fund would reach legal capacity at about $11 billion. That is an achievable benchmark during stock market boom years, but recent history has illustrated that a similar (or even milder) downturn could easily wipe out that fund with capital gains revenue losses, let alone overall personal income losses.
This reinforces a more important point: Merely adjusting for and reacting to volatility provides very limited stability, especially as the state budget comes to rely more on volatile revenue sources. An inverted pyramid can only balance on steadily narrowing base for so long; constantly leaving it exposed to storms only increases its chance of toppling altogether. That is certainly everyone’s problem.

Capital Gains Income
Capital gains income is the profit generated from the sale of an asset held for the purpose of investment. Such assets include real estate, land, machinery, vehicles, furniture, jewelry, patents and trademarks, and securities like stocks and bonds. For a capital gain to occur, the sale price must exceed that of the purchase price. This difference between the sale price and the purchase price is then considered taxable income by the state and federal governments.