


- Politics, Institutions, and Public Opinion
Does the ideology of the Democratic nominee matter when in comes to the 2020 general election? As the first Democratic nominating contests draw closer, the debate over that crucial tactical question has begun to take form in journalistic and scholarly quarters. Some believe that the Democrats can win the 2020 presidential election simply by turning out a large enough share of their base; others believe that unless the party’s nominee appeals to more moderate voters—particularly in the Midwest—President Trump will get a second term. One proponent of the former view, Ryan Cooper, argued in a This Week article titled “Sanders Can Win” that “All Democratic voters have to do is shake off the Pundit Brain and go with the candidate whose record matches the party’s stated values.” The Sanders and Warren campaigns have embraced that view, while those of Biden and Klobuchar seem to agree with the New York Times’ David Brooks that the “party is moving toward all sorts of positions that drive away moderates and make it more likely the nominee will be unelectable.” Meanwhile, Harris and Buttigieg are trying to straddle both camps, staking out a position to the right of Warren and Sanders on health care and education but still remaining to Biden’s left.
One of the more interesting aspects of this debate is the degree to which its basic terms are not well defined. Most conversations about “base” voting incorporate some notion of ideology, with the implication being that the Democrats falling into that group hold more liberal policy positions than the party in general. Zack Beauchamp of Vox gave voice to one understanding of this dichotomy in a January article, explaining “For some time now, the Democratic base has been more aligned with the Congress member (Alexandria Ocasio-Cortez) than with the former President (Clinton), embracing more progressive positions on everything from taxes to immigration to the Israeli-Palestinian conflict. But the party’s elected ranks, and especially its leadership, hasn’t moved nearly as much.” According to this formula, “base” voters seek politicians like AOC, while the rest of the party prefers the establishment. Nevertheless, other notions of the base compete with Beauchamp’s. Particularly notable was the more expansive interpretation the 2004 Bush campaign gave the concept. Bush-Cheney strategist Matthew Dowd told Frontline in 2004 that he had created a graph “. . . that I gave to Karl (Rove), which showed that Independents and persuadable voters in the past 20 years had gone form 22 percent of the electorate to 7 percent in 2000. . . you could lose the 6 to 7 percent and win the election.” Dowd arrived at the 6 to 7 percent figure by assuming that so-called “leaners”—voters who identify as Independents but admit to leaning towards one party or the other—are really closet partisans. This view implies that the Democratic and Republicans bases collectivey encompass about 90 percent of the country. The Dowd definition of the base marks the outer bounds of the concept. After all, political scientists cannot even agree about the strength of the connection between “leaners” and their party. Some, such as Stanford Professor Morris Fiorina have effectively argued that leaners are a heterogeneous collection of individuals that include numerous persuadable voters. Accordingly, assigning leaners to the base voter category gives the label its most inclusive meaning.
In what follows, we adopt the Dowd definition, and treat the leaners as a part of the base. We do so in order to more persuasively illustrate this article’s conclusion: even assuming a generous definition of the term, a Democratic nominee cannot win a presidential election with just base voters. As our analysis of presidential elections from 1952 through 2016 demonstrate, even the most popular base figures needs a little help from the less ideologically committed.
This article makes extensive use of the American National Election Study (ANES), which has collected information about American voters via face-to-face interviews since 1952. This continuous time series allowed us to calculate the approximate partisan breakdown of the American electorate in each year, and whether (and for whom) members of each group voted. We divided the electorate into seven categories commonly used by political scientists (arranged from most Democratic to most Republican): Strong Democrats, Weak Democrat, Democratic Leaners, Pure Independents, Republican Leaners, Weak Republicans, and Strong Republicans.
Using this information, we can estimate the contribution members of each group made to a particular parties vote total. The following example illustrations this process: suppose 25 percent of voters are Strong Democrats, 80 percent are willing to vote for their party’s nominee, and 80 percent of them vote. If the electorate had 1,000 members, and the Democratic nominee received 400 votes, and the Republican nominee received 400 votes, we could calculate that 40 percent of the Democratic nominee’s votes came from Strong Democrats (.8 x .8 x .25 x 1,000 = 160, 160 ÷ 400 = 40 percent) and that 10 percent of the Republican >nominee’s vote came from Strong Democratic “defectors” (.2 x .8 x .25 x 1,000 = 160, 40 ÷ 400 = 10 percent). By repeating the same process for each partisan group and Pure Indepedents, we can determine how strongly a candidate in this electorate relies on the base.
Political scientists largely agree that the ANES provides a fairly accurate estimate of what percentage of the electorate falls into each partisan group and for whom those individuals vote. However, they also agree that ANES respondents over-report voting—that is, more say they vote than actually do. Consequently, we had to correct the ANES turnout numbers in order to get more accurate results. Fortunately, in five elections, the ANES “validated” turnout by tracking down official turnout records to see which respondents in fact cast a ballot. This data allowed us to calculate the percentage by which various partisan groups overestimated their turnout in previous years. We then subtracted the average “phantom” vote from the claimed turnout figures to obtain a more realistic understanding of who actually voted. In the rest of this article, we report these estimates of turnout in our Tables (though the adjustments turn out to have no impact on our actual analyses). With these methodological considerations in mind, we can now move on to addressing the substantive question: can a Democratic nominee win with only the base vote?
Table I displays the “base” contribution, the “defector” contribution, and Pure Independent contributions to the winning party’s vote total from 1952 through 2016. The first striking fact is that, prior to Reagan’s 1984 victory, the Republican base (generously defined) never contributed more than two-thirds of the vote total to Republican wins. In Eisenhower’s two wins, Nixon’s two wins and Reagan’s first win, Democratic defectors and Independents contributed no less that 31 percent of the winner’s vote total, and in 1972 their contribution was over 40 percent. By contrast, Democratic nominees commonly received 80+ percent of their vote from co-partisans during the same period. Figure 1 captures this trend. It tracks the “party vote” (here, defined as synonymous with base contribution) over time, with blue representing Democratic wins and representing for Republican victories.
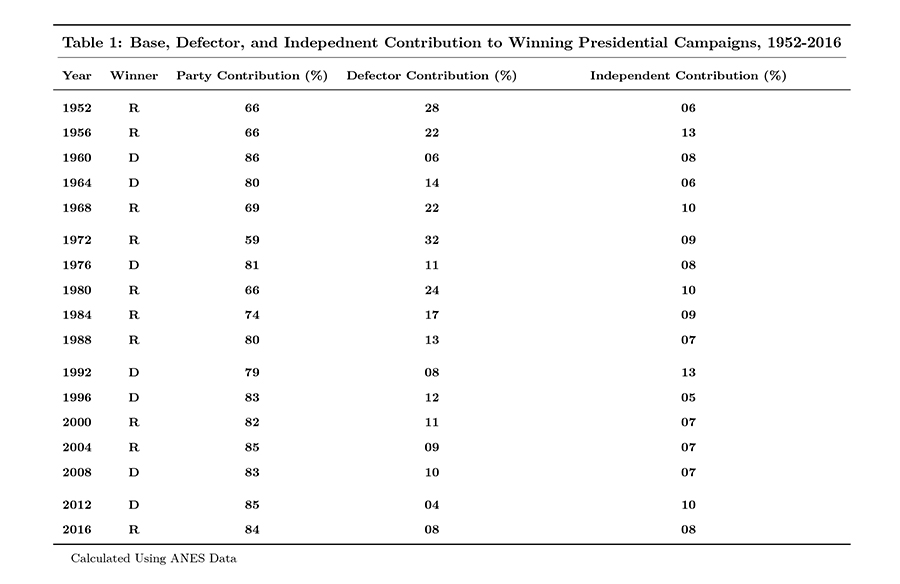
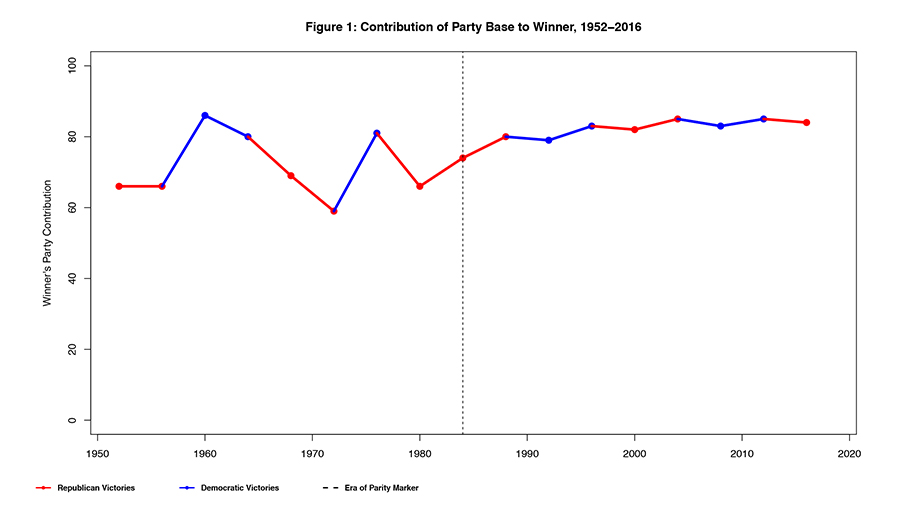
The black dotted line in this figure represents the point of transition. In the years before, Democrats and Republican assembled different types of partisan coalitions in their victories, with Democrats leaning more heavily on the base. In the years after, however, general election winners from both parties have obtained three-quarters or more of their votes from co-partisans (this trend held even in the 1992 election, when Perot siphoned off a substantial portion of both parties’ bases). This shift can, in part, be attributed to shifts in the relative numerical strength of the two major parties. From the New Deal through the early 1980s, the Democratic Party contained a much larger portion of the electorate than the Republican Party—indeed, the disparity was so stark that in some years, the Democratic nominee could have captured the election without a single Independent vote. In the 1980s, however, the number of Republican identifiers increased dramatically, to the point of near parity with the Democrats. With a larger partisan contingent, Republican nominees could rely more heavily on their own base.
Why did the Republican Party make such large gains in the 1980s? A complete answer would require far more space than we have here, but the general idea is that the two major parties “sorted.” Conservatives moved out of the Democratic Party and became Republicans, while liberals left the Republican Party for the Democratic Party. Figures 2 and 3 illustrate this movement. This first tracks the percentage of moderates, liberals, and conservatives identifying with each party, while the second follows the percentage of partisans claiming each of the three ideologies. Figure 2 shows that, in the 1980s, the percentage of Strong and Weak Democrats identifying as liberal increased; the proportion of Strong and Weak Republicans identifying as conservative did the same. In the twenty-first century, these trends accelerated, with Democrats across the board becoming more liberal and all categories of Republican becoming more conservative. As Figure 3 suggests these changes relate to ideological sorting—post-1980 liberals moved into the Democratic Party and away from the Republican Party, while conservatives (the plurality of Americans) moved strongly to the Republicans and away from the Democrats. By 2016, a slight majority of Democrats identify as liberal, while Republicans over 60 percent conservative.
This ideology sorting has heightened the importance of the base vote in presidential elections. Today, fewer partisans are willing to defect than in the past, and party nominees tend to align ideologically with the party’s base. By contrast, pre-1984 nominees faced more heterogeneous parties, and could not as easily side with the internal majority.
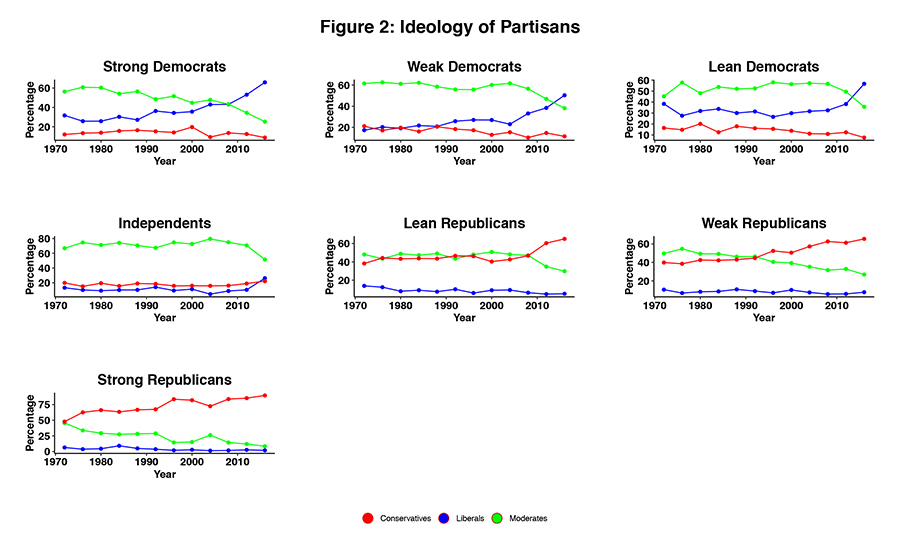
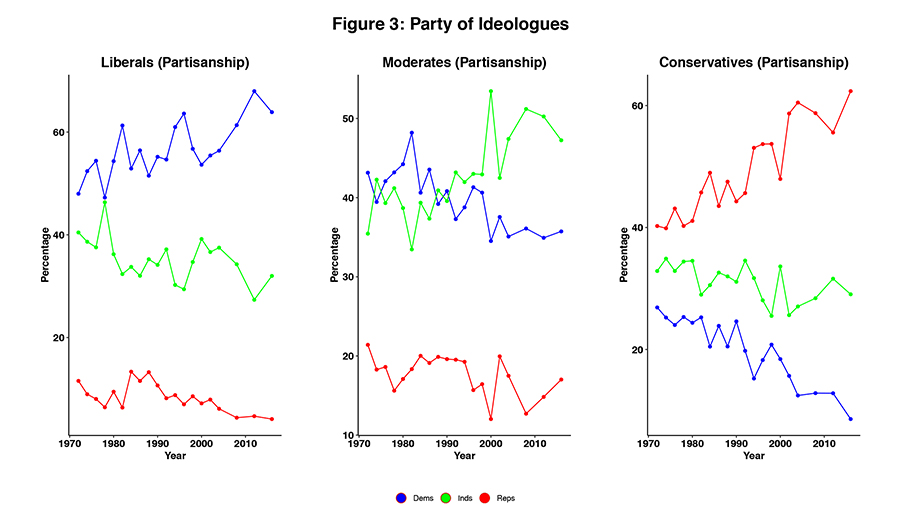
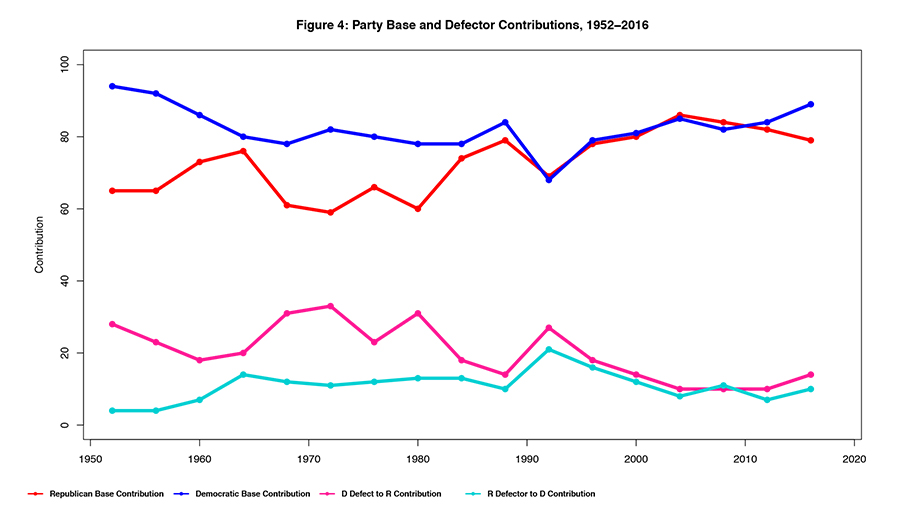
Figure 4 conveys the magnitude of the decline in the role of defectors. Pre-1984, Republicans routinely obtained over 20 percent (and often more than 30 percent) of their vote from Democrats. However, as the new party parity of the 1980s took hold, the number of party defectors begins to even out, and by 1996, defector contributions to each party’s vote had declined to about 10 percent. Consequently, in contemporary presidential elections, Democrats and Republicans usually get a little over 80 percent of the vote from their own partisans.
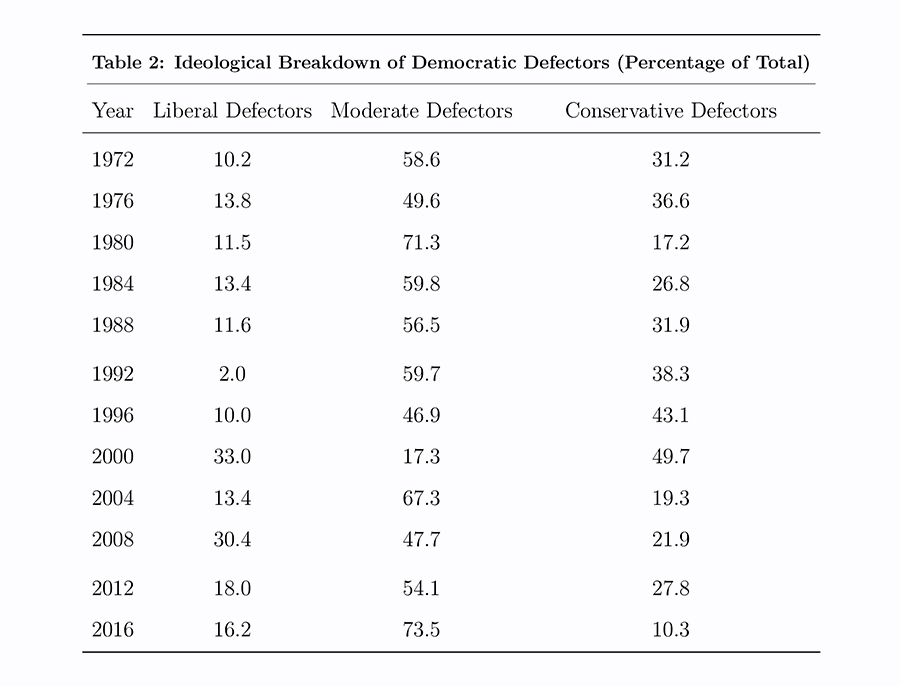
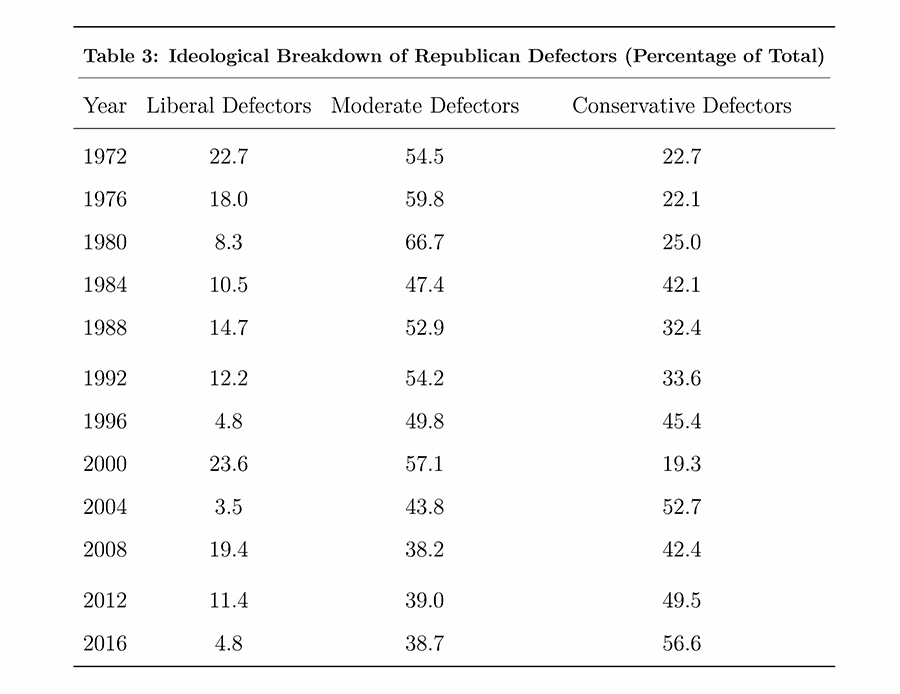
What has not changed, though, is that Democratic defectors to the Republican Party tend to be moderate or conservative. In 1972, the ANES began asking respondents to classify themselves as liberal, moderate, or conservative—Table 2 breaks down Democratic defectors in the years since along that ideological scale. In every case, at least two-thirds of defections have come from moderates and conservatives. Republicans defectors (Table 3) are less predictable, probably because of greater internal ideological consistency. While about half of Democrats still identify as moderate or conservative, less than 35 percent of Republicans call themselves moderates or liberals. Accordingly, it is Democrats who should more consistently fear defections from heterodox partisans.
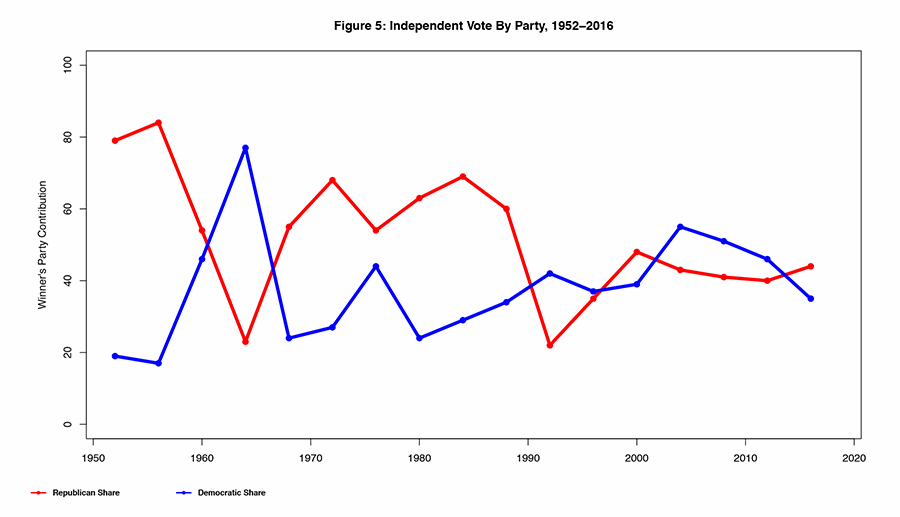
Another trend that has prevailed is the predictive role of Pure Independents. In 17 elections between 1952 and 2016, the winner of the Electoral College has lost the Pure Independent vote three times—in 1960, 1976, and 2004—with only one of those losses coming in the age of party parity (see Figure 5). As the left middle panel of Figure 2 shows, these voters are overwhelmingly moderate, with only about 20 percent identifying as liberals and conservatives, respectively. Consequently, aggressively liberal or conservative nominees risk losing these crucial voters.
Overall, the results show that post-Reagan, the sorting of the political parties (Democrats, liberal plus some moderates; Republicans, conservative plus some moderates) has enhanced appeal of base-only strategies. From Eisenhower through Reagan’s first victory, Republicans had to convert Democrats and Independents to win elections—too few Republicans existed to prevail otherwise, as the 1964 Barry Goldwater campaign demonstrated. For the most part, Republicans were able to execute this strategy successfully, winning 6 of 9 presidential elections from 1952 up to 1988. Democrats, by contrast, have always relied on their base for about 80 percent of their votes, and have lost when substantial numbers of moderate and conservative Democrats have picked the Republican nominee—the elections of Eisenhower, Nixon, and Reagan, all stand as examples of this principle.
At first, glance, this data might suggest that a “base-only” strategy could work, but those who believe as much should look more carefully. While the Democratic Party is certainly more homogeneous than it was 30 years ago, still about half of its voters are moderates and conservatives. These voters are more prone to cross party lines and vote for Republicans on occasion, representing an every-present threat to the Democratic coalition. Moreover, in the modern era of party-parity, Democratic presidential candidates have never obtained more than 85 percent of their votes from their own party. Even in 2012, the year that best fits the description of a Democratic “base victory,” 15 percent of Democratic votes came from Republicans and Independents. In addition, you might recall from earlier in this article that the 85 percent of votes that came from the base includes “leaners”—individuals whose inclusion in the base is iffy at best. Accordingly, even in the best circumstances and with the broadest understanding of the base, Democrats cannot win without capturing Independent and Republican votes (as well as holding onto their own moderates and conservatives!).
A brief look at the key battleground states reinforced this conclusion. In 2016, the party ID gap (the difference between the proportion of Democrats and the proportion of Republicans in the state) was narrower in battleground states than in the non-competitive states, and more moderate and conservative Democrats voted for Trump. Contemporary polling suggests that this situation will recur in 2020. In a recent national YouGov/Economist survey, 47.1 percent of Americans identified as Democrats (including leaners) while only 41.0 percent thought of themselves as Republicans. However, in the 16 states where a swing of 5 percentage points or less would have changed the state-level presidential result, the gap narrows to 44.9 percent Democratic identifiers and 42.9 Republican identifies. As such, even if Democrats received a proportionate share of their votes from their “base” (half of which includes conservatives and moderates), the Independents and Republicans would still need to contribute about 10 percent of their total. Of course, if the Democratic nominee cannot attract this fraction of the Independent and Republican vote, that person is likely to lose some of the less progressive members of the Democratic Party as well.
All of this analysis does not necessarily mean that the Democrats must nominate someone the media perceives as a moderate. Ronald Reagan, for example, was portrayed by some as a radical, but in the 1980 election 24 percent of his vote came from defecting Democrats (primarily due to the poor economy). In order words, there are electoral conditions in which any Democrat could win. What our conclusions do mean, though, is that a Democrat cannot become president without some actual appeal to moderate and conservative voters. To think otherwise would go against 65 years of presidential history.
