- Economics
- Law & Policy
- Regulation & Property Rights
 |
 |
 |
 |
 |
The 2005 press release of the World Trade Organization (WTO), available at http://www.wto.org/english/news_e/pres05_e/pr401_e.htm, highlights the new role China is playing in the world. One can single out three points from the summary of this release in The Financial Times of April 14, 2005.
-
"China has overtaken Japan as the world's third largest exporter (...) After a surge in demand for its electronic goods led to a 35 percent jump in the country's overseas sales (...)
-
Electronic goods account for a third of Chinese exports and between one-third and two-thirds of exports from Singapore, Taiwan, South Korea, Malaysia, and the Philippines (...)
-
Demand from China also helped boost trade in other regions, especially Africa and South America, where Chinese investment in both natural resources and manufacturing has burgeoned in recent years."
To wit, China is the third largest world exporter, after Germany and the U.S., and it has joined the Asian Tigers exporting high technology, high value-added goods. Moreover, having reduced poverty inside, China is now helping to reduce it in the outside world, including Africa. At a time when the advanced industrial nations promote increased foreign aid to Africa and elsewhere to fight poverty, China is not fighting poverty. Instead, China is creating wealth for her own citizens and around the world by producing, and investing, and producing again.
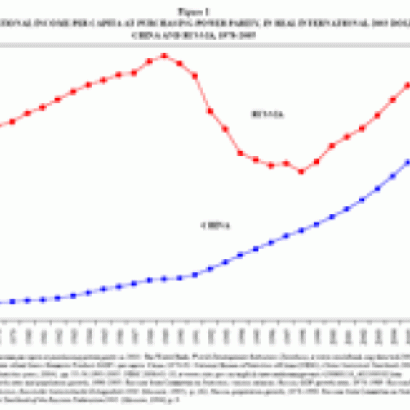
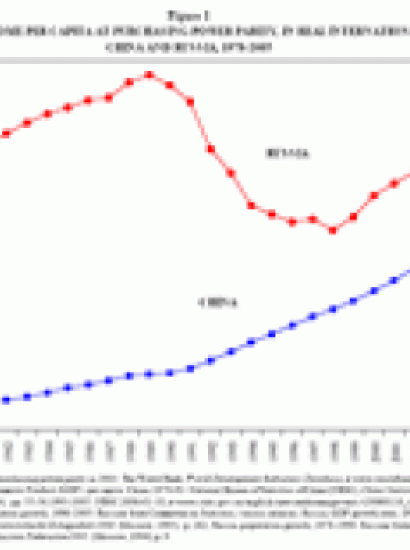
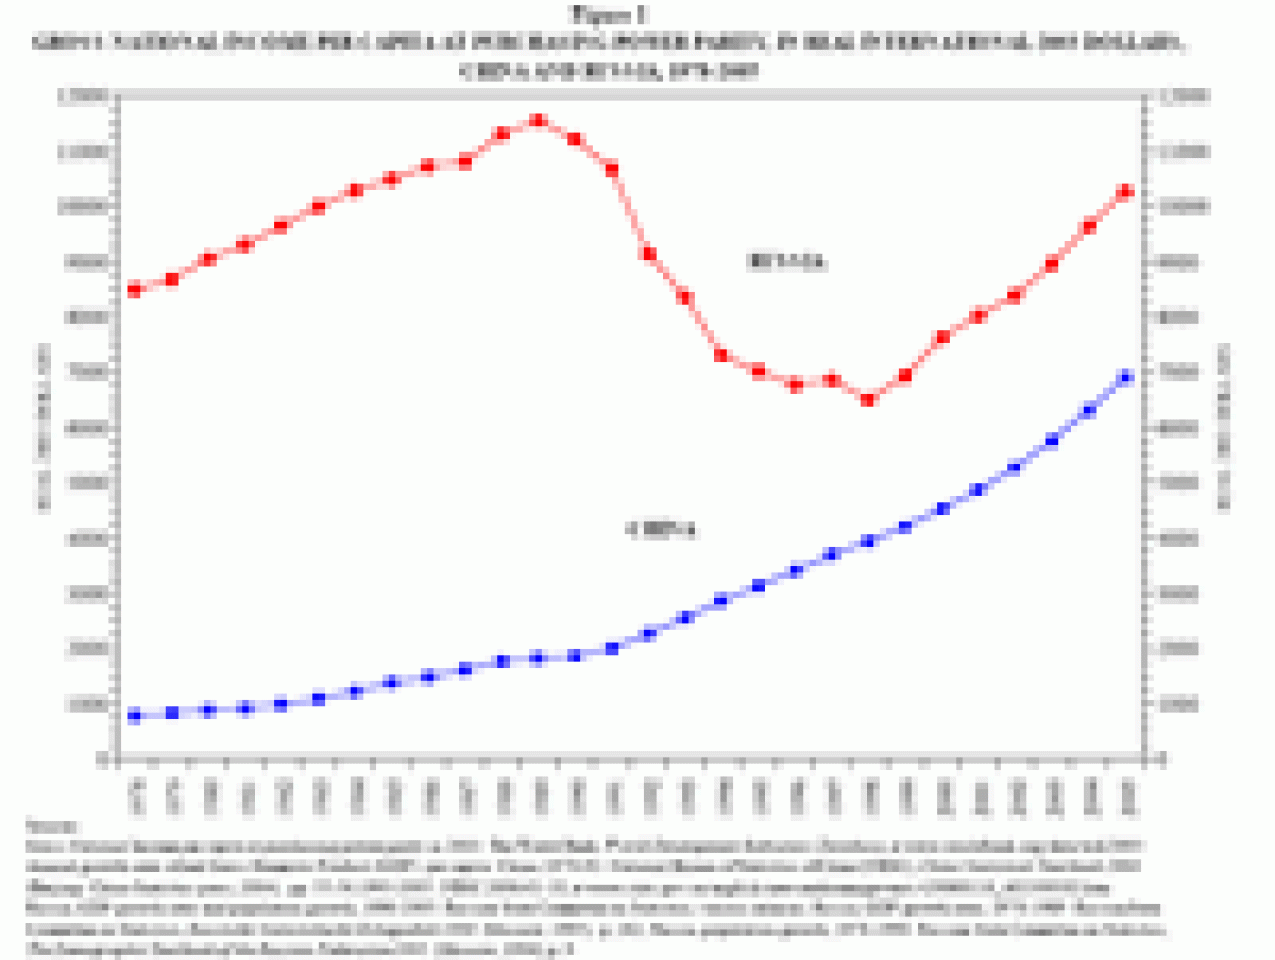
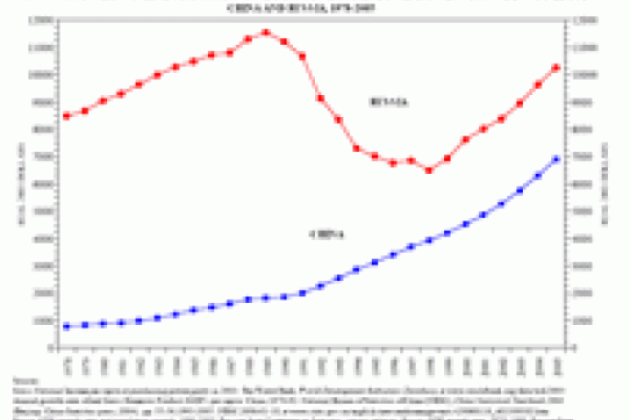
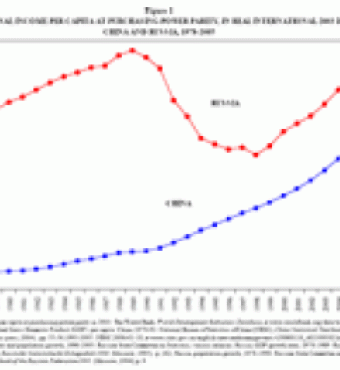
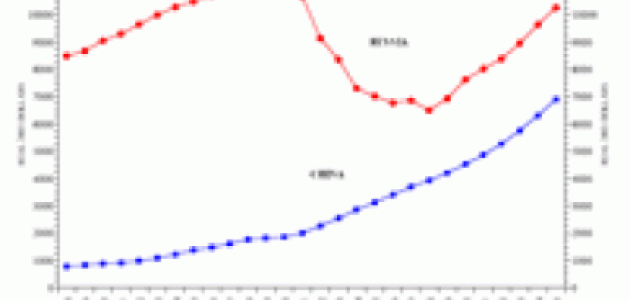
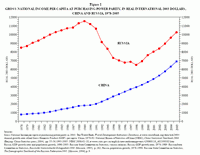
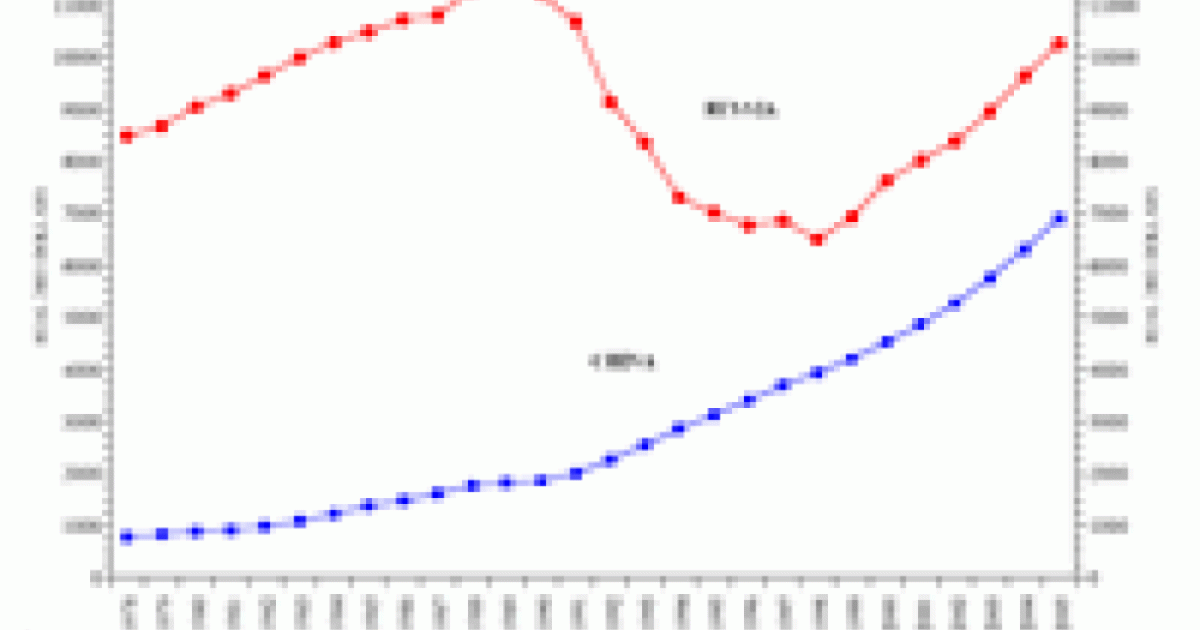
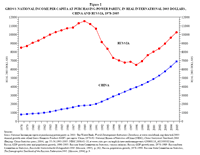
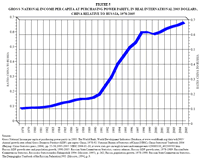
Figure 1 compares the indices of Gross National Income (GNI) per capita in China and Russia in 1978–2005 at purchasing power parity, in real international 2003 dollars.1 At purchasing power parity, that is, at the purchasing power of U.S. dollars inside the United States, China still lags Russia in terms of per capita income. But the long-term differences are profound:
-
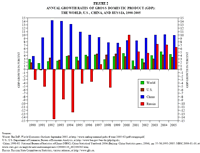
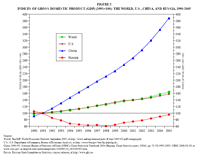
China has grown steadily at about 9.7 percent per annum for 28 years. Its GDP increased by almost 13.5 times. Russia is recovering after the Great Contraction of the 1990s and has only reached 95 percent of its level of GDP in 1991 when it was part of the Soviet Union. Figures 2 and 3 explore this point further. Figure 2 shows that Russia's great contraction in the 1990s was quite unique when the world was growing steadily at about 3 percent per annum. Annual economic growth of 3 percent doubles national income every 23.5 years.2 Figure 3 demonstrates that in just the last fifteen years, 1991–2005, world output as well as that of the U.S. increased by about 60 percent while China's GDP increased nearly fourfold. Figure 1 shows that, adjusted for population growth, today the average Chinese lives almost 3.5 times better than 15 years ago. Meanwhile, Russia has yet to fully recover from the economic debacle of the 1990s. In fact, figure 1 displays that after the onset of reforms in 1992 and until 2003, Russia’s per capita income was lower than at any time since 1978. Talk about la generation perdu of economic well-being. As a result of these reforms, the quarter-century, 1978–2002, was lost for economic progress and prosperity.3
-
Figure 1 makes another striking point. Had Russia's GDP not recovered in 1999–2005 and either stagnated at the level of 1998 or continued to contract, China in 2005 would have overcome Russia in terms of GDP per capita. Russia's recovery in 1999–2005 was accidental. It can be attributed to a major policy reversal which constituted partial deliberalization and de-privatization, to wit, a partial counter-reform against the 1990s.4 Absent this reversal and its concomitant output recovery, that is, if the policy of the 1990s continued, Russia's per capita GDP would have fallen below China's by the end of 2005.
-
Most importantly, inferring from figures 1 and 3, Russia's level of per capita income, still above China's, is inherited from central planning, from the bad old Soviet Union. China's level of per capita income is earned. Whence follows the final point.
-
Russia relies on inherited natural wealth and on inherited Soviet capital stock, human capital, and the level of technology. China creates new industries and new technologies, moving to more and more advanced frontiers, as reported recently by the WTO.5 Figure 5 ventures to create the trajectory of a relative index of GDP dynamics, China relative to Russia, in 1978–2005. It shows how China catches up with Russia, slowly in 1978–91, then rapidly in 1992–98, during Russia's great contraction, and slowly but steadily again in 1999–2005, at a time of Russia’s economic recovery. Figure 2 documents this point for the two latter periods using annual growth rates. The rise from 1978 to 2005 is dramatic. One can observe an eightfold increase in figure 5. Starting with a bare 8 percent of Russia's level of per capita income in 1978, China has reached 67 percent in 2005. Given this trajectory, China can overtake Russia's per capita income by the year 20156. In all probability, this may happen earlier because Russia's recovery will have to transcend into economic growth beyond the level inherited from the Soviet Union. Russia may reach the full recovery point and catch up with the former Soviet Union in terms per capita income. But it will need technological progress and systemic productive incentives, rather than inherited wealth, for further growth, for wealth creation as opposed to a mere recovery. There are no signs of Russia's development in this direction.
Russia squandered its inherited wealth and is now recovering from poverty self-inflicted in the 1990s. China started dirt poor and created wealth. As the WTO data refer, China now helps create wealth around the world and is bound to expand at that.7
1. The concept of GNI is identical in the accounting sense to Gross National Product and subsumes Gross Domestic Product (GDP). GDP combines the sum of value added and net product taxes not included in the valuation of output. GNI adds net factor income from abroad. Figures 1 and 5 apply GNI per capita in 2003 at purchasing power parity in real international 2003 dollars (which have the same purchasing power of GNI as U.S. dollars inside the United States) to the series of GDP per capita in 1978–2004. The data for China in 1993–2004, including the upward adjustment of its GNI per capita in 2003 at purchasing power parity by 15.7 percent, employ the revised series issued by the National Bureau of Statistics of China (NBSC) in 2006 (NBSC, "Announcement on Revised Result about Historical Data of China's Gross Domestic Products," at www.stats.gov.cn/english/newsandcomingevents/t200601010_402300302.htm. The distortions resulting from applying the GDP dynamics to the GNI statics are negligible.
2. Under 3 percent annual growth of GDP and zero population growth, each next generation lives twice as good as the previous one. Given average global population growth rate of one percent per annum (projected by the World Bank for 2003–2015), with the 3 percent annual growth of GDP, income per capita doubles every 35 years.
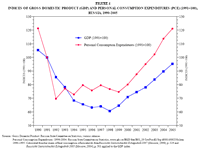
3. The same historical judgement applies to personal consumption. Figure 4 juxtaposes its dynamics in 1990–2005 with that of GDP. Personal consumption expenditures (final consumption of households in the Russian data) fell less than GDP in 1991–98. Personal consumption decreased by 30 percent as compared with the 40 percent contraction in GDP, because gross domestic investment and government consumption (primarily military hardware) fell even more, while net export (capital outflow) expanded. Only in 2003, personal consumption recovered to the pre-reform level of 1991 and only in 2005 it recovered to its level in 1990.
4. For a detailed discussion, documentation, and data analysis see Michael S. Bernstam and Alvin Rabushka, "An Accidental Illiberal Recovery: Russia, 1999–2005," at http://www.russianeconomy.org/comments/01102006.pdf
5. A week after the WTO release, on April 21-22, 2005, the U.S.-China Economic and Security Review Commission held a two-day public hearing at Stanford University. The topic of the hearing? But of course, it was on China’s High Technology Development. One can review the hearing’s agenda at http://www.uscc.gov/hearings/2005hearings/hr05_04_21_22.htm . The Commission was established by the U.S. Congress in 2000 to monitor and submit an annual report to the Congress on the national security implications of the U.S.-China bilateral trade and economic relations. As the time progressed, the focus has shifted to high technology. Just consider the titles of the panels: “China’s Global Technology Competitiveness,” two panels; “China’s High-Tech Development Strategies,” “Dynamics in the U.S.-China High-Tech Relationship,” “Challenges to U.S. High-Tech Leadership,” and “China’s Science and Technology Trajectory.” The press release summarized it thus: “China’s rapid economic expansion has been accompanied by significant advances in technology competitiveness. China has become a vital part of the global supply chain for technology goods as well as increasingly a center for technology research and development. Together, these developments are leading to advances in China’s capacity as a base of technology innovation and competitiveness.” Or, as Ezra Pound wrote in “Canto XIII”, “A day when the historians left blanks in their writings, // I mean, for things they didn’t know, // But that time seems to be passing (...) // The blossoms of the apricot // Blow from the east to the west.”
6. In addition, Gregory C. Chow in his definitive book, China’s Economic Transformation (Malden, MA and Oxford: Blackwell Publishers, 2002), pp. 102–103 offers growth projections on how, under various assumptions, China will overtake the U.S. in terms of total GDP at purchasing power parity by the year 2020. See also pp. 379-384 of his book for further analysis and substantiation.
7. This comment summarizes two talks, at Forum 21 in Saint-Syr-ser-Mer, Provence, on April 7, 2005, and at Stanford University on April 15, 2005. It extends our comparison of Russia and China in Chapter 2 of From Predation to Prosperity and in Addendum to Chapter 4, “Fixing China’s Banks, Not Russia’s.” Special thanks are due to Inez Schreiden of Forum 21 for helping sharpen this comparison by contrasting poverty reduction vs. wealth creation and for other insights. This comment has been updated in view of the revised GDP series released in China in January 2006.


