


In recent examinations of California Gov. Jerry Brown’s January proposed budget and the May Revise, one characteristic about the Golden State’s budget—in addition to the proposed record General and Special Fund expenditures—is stunning: since fiscal year 1984-1985, in inflation-adjusted terms, Special Fund expenditures have increased almost 3 ½ times faster than General Fund spending.
In total, between FY 1984-1985 and FY 2014-2015, Special Fund expenditures have increased by a little over $35 billion. And just five spending categories—Health and Human Services (54.8%), Transportation (13.9%), Legislative, Judicial, and Executive (8.1%), Environmental Protection (7.4%), and Corrections and Rehabilitation (6.8%)—account for 91% of that growth.
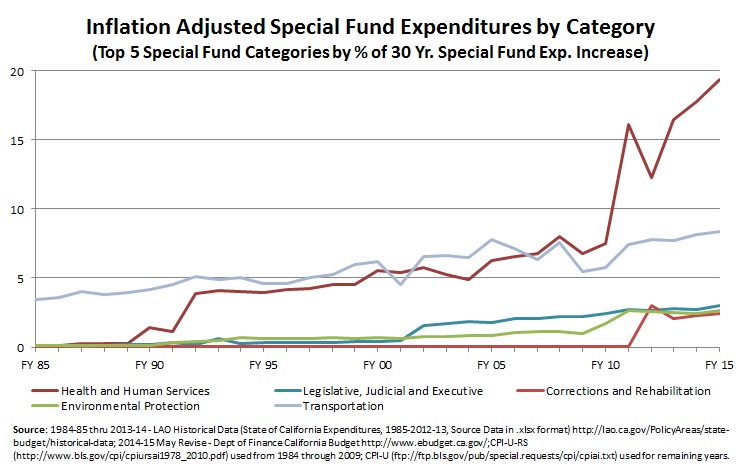
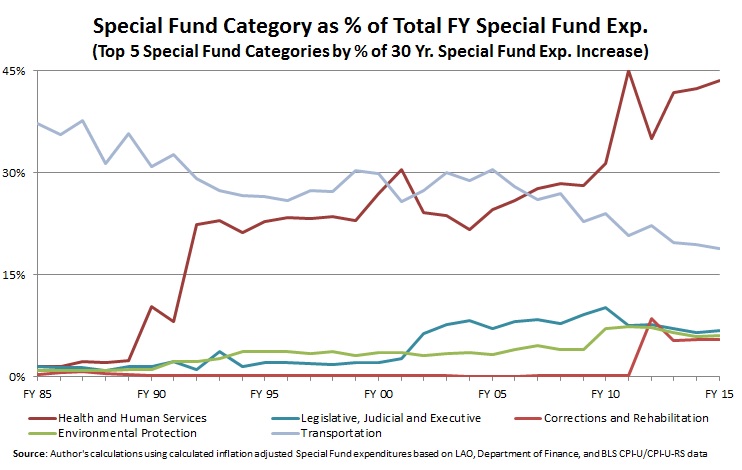
Traditionally, Transportation had been the leading expenditure source for the various special funds; however, Health and Human Services has steadily increased over the decades, exploding in FY 2010-2011—largely the result of the Department of Health Care Service’s responsibility for implementing Obamacare in California. In FY 2009-2010, Health and Human Services accounted for 31% of the Special Fund total expenditures. A year later, it had risen to 45%.
As such, over the last thirty years, Health and Human Services has gone from representing merely 1.5% of total Special Fund expenditures to nearly one-half. Meanwhile Transportation has fallen from a high of 37% to 19%. Legislative, Judicial, and Executive as well as Environmental Protection Special Fund spending has steadily increased: the former from 1.5% to almost 7%, while the latter has increased from less than 1% to 6%. Corrections and Rehabilitation was just a fraction of 1% of total Special Fund spending until FY 2011-2012 when it jumped to 8.5% before settling around 5.5%—the result of reorganization of the state’s prison system and a growing state prison population.
All of which affects the overall state budget.
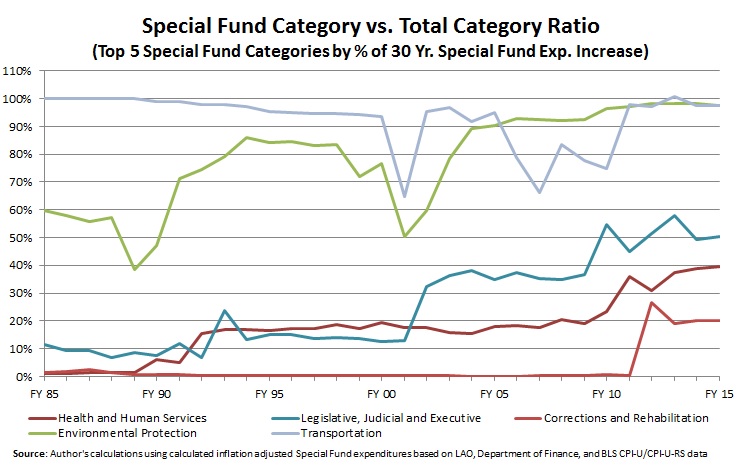
According to the May Revise, just 38% of total General and Special Fund expenditures come from the Special Fund; however, this is more than double what is was thirty years ago (15%). Even though Health and Human Services is also the second largest component of General Fund spending (after K-12 Education), Health and Human Services Special Fund expenditures still account for 40% of overall General and Special Fund expenditures. Meanwhile, the Transportation and the Environmental Protection Special Fund spending account for basically all of these spending categories expenditures by the state.
Oddly enough, the advantages of Special Fund budgeting also are its disadvantages. By definition, a “special fund” must be earmarked for a specific purpose. As Investopedia notes, “special revenue funds provide an extra level of accountability and transparency to taxpayers that their tax dollars will go toward an intended purpose.” In addition, these funds are typically funded by a special, dedicated revenue source such as a cigarette excise tax, rather than general tax revenue sources like the personal income tax.
However, these advantages can be a double-edged sword. For one, the restricted nature of special funds adds further complexity to California’s already overly complex budget. This eliminates flexibility. Some might see this as a virtue, but budgeting is all about priorities—and when aspects of a budget are locked in, it makes it harder to appropriately prioritize.
Second, sometimes these funds’ money goes unspent for years. Thus, they become a tempting target for lawmakers on the prowl for extra dollars. In the last fiscal year, for example, state leaders raided $500 million of AB 32 cap and trade revenue—meant to reduce California’s carbon footprint—to help plug a General Fund budget hole. This then creates an additional liability for the state; not only will California owe the cap and trade account $500 million, but also accrued interest from borrowing it.
Finally, the dedicated revenue source typically a) violates sound tax policy—instead of being low rates with a broad base, they have high rates and a narrow base and b) is prone to diminishing returns. Most of the dedicated revenues come from “sin taxes” that are designed to dissuade bad social behavior (i.e., drinking and smoking). However, the state’s desire to modify behavior comes with a price: the fewer people who give in to their vices, the less the revenue for Sacramento. For instance, as of June 30, 1999, revenue from the cigarette tax was $148 million. But as of June 30, 2011, that revenue had dropped 35%, to $96 million. That’s good news for health living. However, it’s bad news for the state’s fiscal health when lawmakers dedicate these shrinking revenue streams to recurring spending programs. At some point, the revenue will not cover the expenditure, meaning either higher or additional taxes are needed or money must be diverted from General Fund—at a cost to other spending priorities.
If Special Fund expenditures remain a small part of overall spending, the double-edged sword does not present a major problem. However, as such spending increases, as it has – and rather rapidly, especially recently – these issues make fiscal responsibility more complicated.
Follow Carson Bruno on Twitter: @CarsonJFBruno
