


- Economics
In February 2018, the stock market suddenly returned to greater volatility. The emergence of volatility seems alarming and raises some questions. Is today’s situation like 1929, a harbinger of economic catastrophe? Or is it like 2007? Is it like 1974, the annus horribilis in which the stock market drifted down 40%, along with economic stagflation, and did not recover until the 1980s? Is it like 1987, a quick dip followed by recovery in a year? Or is it just an extended version of the flash crash of 2010 when the market went down 10% in a few hours, and bounced back by the end of the day? Are we in a "bubble" that's about to burst? How much does this have to do with the Fed? Let’s think through some of the logical possibilities here.
Why do prices fall?
Stock prices fall when there is bad news about future profits, or when the discount rate rises. The discount rate is the rate investors require, looking forward, to get them to buy stocks. If people require a better rate of return, with no change in their expected cash flows, prices drop. Stop and think about that for a second, as it's counterintuitive: The only way to get a better return out of the same profits or dividends is for today's price to drop.
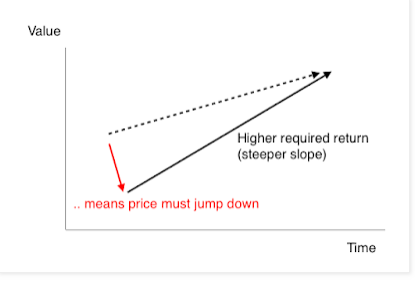
Another way to think about it: Suppose good alternative profitable opportunities suddenly arise for your money—bond interest rates rise, or it's a good time to take money out of markets and invest in a private company. Well, people will try to move money to those alternatives. But the stock market is a hot potato; someone has to hold the stocks. So stock prices must decline until the rate of return going forward matches the other attractions on a risk-adjusted basis. Good news about returns going forward is bad news about a downward jump in stock prices.
Bad news about cash flows is, well, bad news. The dashed line shifts down. Your stocks are not going to pay off as well as before. Higher required returns are neutral, really, for long-term investors. The price drops today, but the higher returns mean the price will slowly recover, just as long-term government bonds do.
So do current stock market drops reflect bad cash flow news or higher discount rates? And does current volatility reflect quickly changing opinions about cash flows, or about discount rates? Most commentary suggests the problem is not bad news about cash flows. The economy seems finally to be growing, and there aren’t any major issues brewing, like the subprime crisis of 2007. A trade war is bad news, but as hare-brained it is, the current measures don’t amount to a lot of GDP. That doesn’t mean there aren’t problems out there—but it means that we’re not reading about them in the news.
So let's think about discount rates. Why might investors require a higher return on stocks? Is it interest rates? Is it a risk premium? Are we in a "bubble'' that is about to pop? And to what extent is the Fed behind it all?
Let's start by reviewing some facts. Here is the cumulative return on the New York Stock Exchange since 1990. (The data stops on 12/31/2017 so I don't show the recent drop. The larger index including NASDAQ shows a larger rise and fall in the tech boom and bust, but is otherwise about the same.)
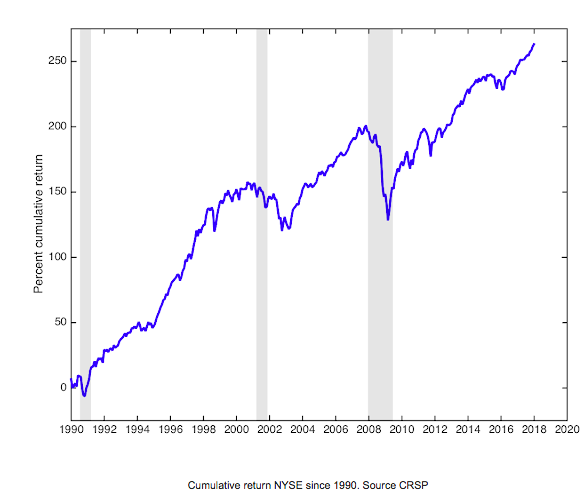
This graph does not show anything terribly unusual about the recent period. Stocks drift up during expansions, and take a beating in recessions. There are also little blips like the election panic of November 2016. But the slope of the line is not at all unusual lately—as arguably it was in the late 1990s.
Why have stocks gone up so much? Well, mostly because the expansion has gone on so long. The recent period is also notable in that the little wiggles are much smaller—that is, there is less volatility. But that ended recently.
Next, look at the price-dividend ratio.
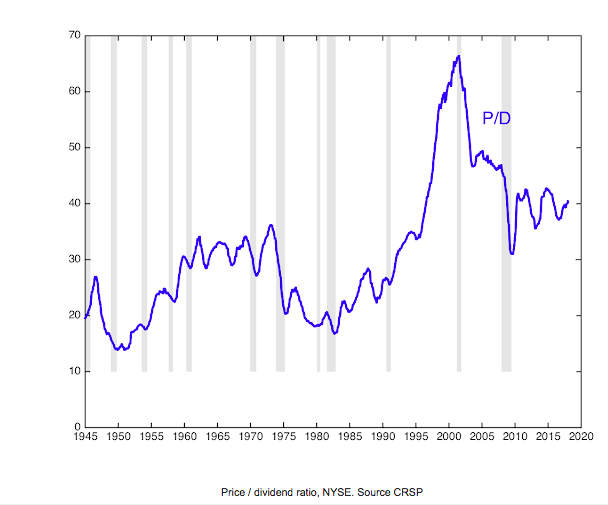
You can see prices were high relative to dividends in the booming 1960s; they really rose in the late 1990s before the big 2000 bust. Then you see the 2008 crisis and recovery, and more recent wiggles. You can see prices fall in recessions, even relative to dividends, which also fall in recessions.
Where is the booming stock market? Stock prices relative to dividends have not grown at all since the end of the recession. Well, evidently, dividends have been rising just as fast as prices in the current expansion—which, again, weren't rising all that fast anyway. So the main reason stock prices are high is that dividends are high, and people expect that slow growth to continue.
So here we were before the recent drop. Are prices too high? Well, not as much as in 1999 for sure! But the price-dividend ratio is a lot higher than historical norms. Is this the beginning of a drop back to historic levels? Or is this a new normal? There is way too much commentary lately that the price-divided ratio of 20 years ago was "normal" and that it should go back to that level, which would imply a big stock market decline. But just because things were different doesn’t make them more “normal” than now.
Interest rates and stock prices
To think about whether stocks are in fact high, and headed for a fall, we need to understand what determines the price-dividend ratio. Over long time periods, the return you get on stocks is the dividend yield—how many dividends companies pay per dollar invested—plus the growth in dividends. Over short time periods, you also get price appreciation per dividend, but over long time periods, the ratio of price to dividends comes back and price growth is the same as dividend growth. Prices depend on the expected return going forward, and expected dividend growth. Prices are high relative to current dividends if people expect a lot more dividends in the future. In sum, return = dividend yield plus dividend growth, looking forward. We also think of return in terms of two components, the risk free rate plus the risk premium. Conversely, we have the ``Gordon growth’’ formula—that price-dividend ratio equals the inverse of the expected return less the expected dividend growth rate.
What this means is that stock prices are very sensitive to real interest rates, risk premiums, and growth expectations. At our current price-dividend ratio of 40, for example, return-dividend growth is 1/40 or 2.5%.. Just half a percent change in expected return or growth rate, to 2.0%, would raise the price dividend ratio to 1/0.02 or 50, a 25% rise in stock prices. Conversely, a half percent rise in real interest rates would mean a 16.7% fall in stock prices. No wonder stocks are (usually) volatile!
Now, to what's going on? If we take growth rate expectations off the table, and hold the risk premium constant, then stock prices are moving because of changes in interest rates. And small interest rate changes do indeed imply big stock valuation changes—though, again, take heart, because a lower price then means the rate of return is higher, as in the first picture.
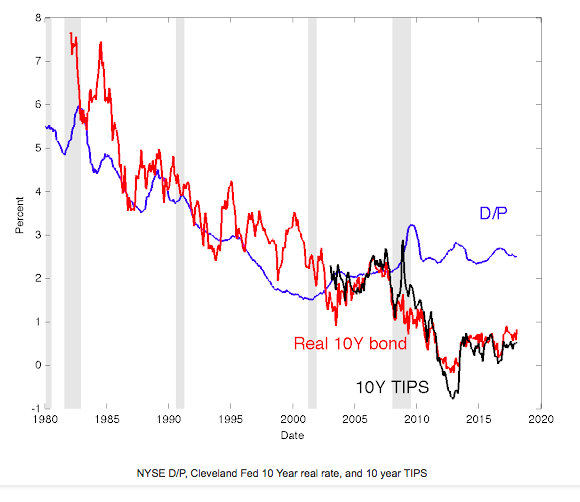
Does this relationship hold historically? Here is the D/P ratio, which is the inverse of the price-dividend ratio, and a measure of long-term real interest rates.
This is a remarkable graph: The entire rise in valuations from 1980 to 2008 corresponds exactly to the decline in real interest rates.
By this measure, the decline in real rates was huge, from 7% to essentially 0%. It means that stock prices are exactly where they should be. In fact, by this measure, stock prices are too low. In 2008, real rates kept right on trundling down another two percentage points, but the dividend yield stabilized.
Well, I was careful to say that the rise in valuations from 1980 to 2008 "corresponds to" the decline in real interest rates, and not one “caused” the other. The risk premium and growth expectations changed as well. Arguably the move to a low-growth economy starting in 2000, cutting one to two percentage points off dividend growth offset the decline in the real rate.
Or perhaps the risk premium isn't as low as most commenters think it is. This isn't just waffling—the relationship between dividend yield, dividend growth, and return is basically an identity. One of those options must be true.
The graph reminds us 1) Real rates have come down a lot, and 2) persistent changes in real rates really are an important part of stock market valuations. Oh, and they have nothing to do with risk appetite' and all that other blather. Stocks are valued like bonds plus risk. We are noticing here that the bond-like component got much more valuable. That alone, not the risk component or the growth component, accounts for two decades of huge price rises.
Editor’s note: A version of this essay originally appeared on the author’s blog, The Grumpy Economist. To continue reading this essay, please click here.
