- Budget & Spending
- Economic
- Economics
- History
Victory has a hundred fathers and defeat is an orphan," as JFK said after the Bay of Pigs fiasco. As an illustration of this dictum, there are many claiming fatherhood, or claiming to know the father, of the current golden economy and one of its apparent progeny — the federal budget surplus. Unfortunately, there is no DNA test for determining the real father of the economic successes of the past five years. The popular nominees — among them Alan Greenspan, Bill Clinton, Ronald Reagan — are likely to be found to have had an influence. But many people and things, known and unknown, planned and accidental, were players in the outcome. It’s high time to ask and try to answer the basic questions about the surprising appearance of a federal surplus two years ago. Where did it come from? How closely tied is it to the economy or to the policy actions of Congress and the president? How realistic are the assumptions underlying the projections of huge surpluses over the next decade? And what should we do with these surpluses?
The history
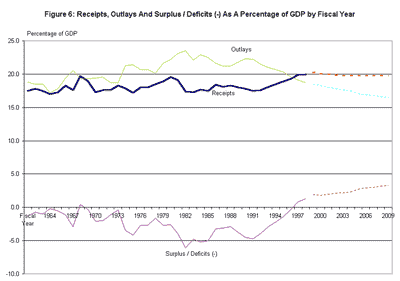
In fiscal 1998, total revenues taken in by the federal government exceeded total federal spending, producing a surplus of $69 billion. (This is not the only definition of the surplus — but more about that below.) In 1999 the total surplus grew to $124 billion. According to projections of the Congressional Budget Office (CBO), it is expected to be $179 billion (1.4 percent of GDP) this year and grow to about $500 billion in 2010. Over the period 2000-2010, the annual surplus is predicted to average more than 3 percent of GDP.
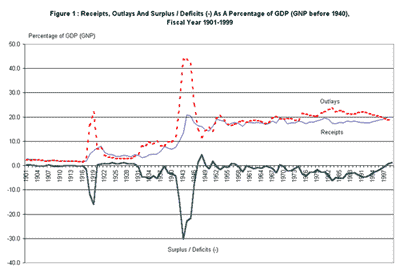
If this projection should be realized, it would be a marked departure from the past seven decades. As Figure 1 shows, we have not had many years of surplus since 1930 (10 to be exact). It is true that surpluses were more the rule than the exception during the first 30 years of the 20th century. (There was an unbroken string of 11 years of surpluses in the 1920s.) But those surpluses were generally less than 1 percent of GDP. Evidently, before surpluses could grow too large, they were reduced or eliminated by downturns in the economy or by tax cuts (before the 1930s) or spending increases (after World War II).
The historical data make it clear that wars and deep recessions have always been major causes of large deficits. The deficit reached 16 percent of GNP in World War I and 30 percent of GDP in World War II; and when the depression of the 1930s replaced the Roaring ’20s, Calvin Coolidge’s surpluses gave way to large deficits.
Lesser recessions and smaller wars (Korea, Vietnam) were also associated with deficits in the postwar period. But they cannot account for the trend of a widening deficit that began in the 1970s and grew to an annual average of 4 percent of GDP during the 15 year period 1980-94. That story is complex, involving the huge increase in the size and scope of the federal government after World War II and the rise of entitlement programs to a dominant share of budget outlays. The Reagan presidency marked the beginning of an ongoing national struggle over continuing growth in government, which likely had the effect of temporarily increasing the deficit. Rising federal outlays were not matched with rising taxes. But to do that likely would have put a permanent seal on higher spending levels.
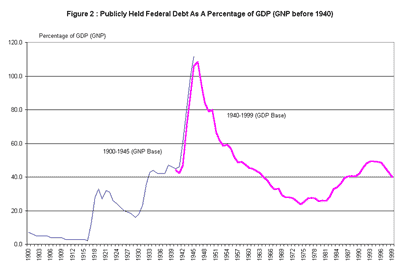
Deficits if unchecked enlarge the national debt. Wartime deficits unavoidably increase the debt, which soared during World War II to a level well in excess of GDP (see Figure 2). Rapid growth in GDP during the 1950s and ’60s reduced the ratio of debt to GDP, even though in absolute size the debt increased in most years because of continuing deficits. However, with growing deficits and slower growth in the economy, the debt eventually rose as a percentage of GDP from its post-World War II low point of 24 percent in 1974 to top out at almost 50 percent from 1993 to 1995. The recent shift from deficit to surplus has already had a favorable impact on the debt. By the end of 1999 the debt had declined to 40 percent of GDP and, if the CBO projections materialize, it would almost disappear, declining to 6 percent of GDP by the end of the decade. The CBO projections assume adherence to current budget policy — that is, no new legislation affecting taxes or spending — and therefore they assume that all of the projected surplus will be used to retire the debt. However, even if the projected surplus is eliminated by tax cuts or spending increases, current projections indicate that simply balancing the budget would reduce the ratio of debt to GDP to about 26 percent by 2010.
Putting aside the tough question of what debt level presents an economic problem, it is worth noting that although the current level of U.S. debt is around 40 percent of GDP, it is not high in comparison with other major developed countries. In 1998 the average debt to GDP ratio of the members of the European Monetary Union was about 70 percent, and in three of those countries — Belgium, Greece, and Italy — the debt exceeded 100 percent of GDP. (These countries recently have been been reducing their deficits and debt to meet the membership terms of the Maastricht Treaty on monetary union, which require a debt no higher than 60 percent of GDP.)
From ’80s deficits to ’90s surpluses
In order to understand where the current surplus came from, it is useful to examine the factors that contribute to budget outcomes generally and therefore to both the widening deficits of the 1980s and early 1990s and the recent surplus. The following factors are important in any account of the budget:
· The economy — in particular, the rate of growth of real GDP, the rate of inflation, and the level of interest rates. The distribution of income is also key because the larger the share earned by the rich, the more income is taxed at the tax code’s highest rates — therefore, the higher the effective tax rate on all income.
· Budget policy — tax and spending legislation affecting present and future levels of revenues and outlays and budget rules that have explicitly attempted to control tax and spending legislation and limit the deficit.
· Unexpected events that affect the economy or the budget. Such exigencies as wars, oil shocks, a savings and loan crisis, or a surge or collapse in the stock market can have a huge effect on the federal budget.
· Economic and budget forecasts. These set the baseline for all budget legislation. When forecasts are overly optimistic, as they were in the 1980s, budgets are more prone to yield deficits because expectations of good times allow higher budgetary spending than is actually affordable. When forecasts are overly pessimistic, the reverse occurs. The cbo forecasts of the middle 1990s were famously off course as the stock market and other factors produced unexpected bumper crops of tax receipts.
During the 1970s there were two negative economic developments that had major effects on the nation and the budget. One was a sharp slowdown in productivity growth from the high levels of the 1950s and 1960s. The other was a major inflation that had gathered steam over the decade, soaring to an annual rate of increase in consumer prices of 13.5 percent by 1980. The productivity slowdown reduced the growth in national income at the same time that Social Security and other entitlement programs were growing rapidly. The budget deficit widened to 2.7 percent of GDP in the last years of the ’70s.
The high and accelerating rate of inflation had a direct influence on the budget at the end of the 1970s and early 1980s by sharply raising the effective personal income tax rate: Inflation raised nominal incomes, pushing people into higher tax brackets (the income tax was not indexed at that time). Because marginal and average tax rates for a large portion of taxpayers had increased to unprecedented levels, there was growing taxpayer discontent (recall the limitations placed by voters on state taxing power) and popular support for a cut in the federal income tax. Under the circumstances, a tax cut of some kind likely would have been on any president’s agenda.
Reagan’s 1981 tax cut
As is well known, large-scale tax reduction was a central element of the Reagan campaign, both for reasons of promoting long-term economic growth and for providing tax relief from inflation-induced bracket creep. The Economic Recovery Tax Act of 1981 (ERTA), built largely on the Reagan administration’s proposals for across-the-board cuts in marginal rates and indexing of the tax brackets against inflation along with an increase in depreciation allowances for business, was passed in both the Senate and the House by overwhelming majorities.
It is widely believed that ERTA was a major contributor to the large deficits of the 1980s. Was this true? The answer is that ERTA surely contributed to the deficit; but the more difficult and important question is whether the long run effects were on balance more harmful or beneficial given the alternatives.
The Joint Committee on Taxation (JCT), which is responsible for estimating the revenue effects of all legislation being considered by Congress, predicted that by 1984 ERTA would result in a revenue loss of $148 billion compared to the revenues expected under pre-ERTA law. That is a substantial loss, amounting to almost 4 percent of GDP. As it turned out, tax revenues as a percentage of GDP averaged around the same level as they were during the Carter years — the annual average for 1981-88 was 18.1 percent (that is with some help from subsequent tax-raising legislation). But in the absence of ERTA, taxes would have been a much higher proportion of national output — about 21 percent of GDP in 1984 and still higher later on. That would have been enough to eliminate 80 percent of the 1984 deficit. But the price for that deficit reduction would have been sharply higher marginal tax rates that likely would have impeded economic growth in the long run. Moreover, by accommodating higher levels of spending with tax increases, pressure to restrain spending growth (and therefore help control future deficits) would have been diminished.
Figure 3
Spending and Outlay Components as a Percentage of GDP (4 year average)
|
1 |
2 |
3 |
4 |
|||
|
Years |
Defense |
Discretionary |
Entitlements |
Net Interest |
Total |
|
|
Nixon/Ford |
73-76 |
5.6 |
4.4 |
9.9 |
1.5 |
20.0 |
|
Carter |
77-80 |
4.8 |
5.1 |
10.3 |
1.7 |
20.8 |
|
Reagan I |
81-84 |
5.8 |
4.4 |
11.3 |
2.6 |
22.7 |
|
Reagan II |
85-88 |
6.1 |
3.7 |
10.4 |
3.1 |
22.1 |
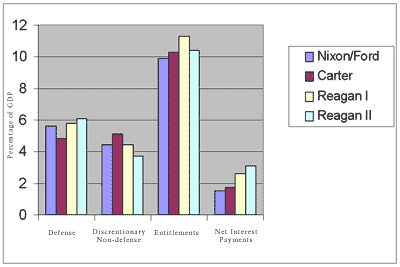
The spending side also contributed to the 1980s deficits (see Figure 3). Outlays over the period 1981-88 averaged 22.4 percent of GDP a year, and that was 1.6 percentage points above the average for the Carter years. The popular view is that the Reagan defense buildup (reversing a decline from 1973 to 1979) was the main factor in this growth in outlays. However, the growth in interest payments on the outstanding debt (fed by the enormous rise in interest rates at the end of the ’70s and early ’80s), and a surge in entitlement spending in the early 1980s, were also major contibutors. Even after inflation had been sharply reduced, inflationary expectations kept interest rates high into the mid-’80s. The composite interest rate on new and old debt paid by Treasury increased by about 2.4 percentage points between 1979 and 1985.
Over the period 1982-1986 the deficit averaged about 5 percent of GDP. But during the last half of the 1980s the deficit picture improved as real GDP growth increased to a healthy average of 3.7 percent a year, while tax revenues grew by slightly more. At the same time, the growth in both discretionary and entitlement spending declined as a percentage of GDP. By 1989 the deficit was reduced to 2.8 percent of GDP, which is slightly above what it was in 1980.
The good times, however, did not last. In 1990 the economy again slipped into recession, which was further exacerbated by the Gulf War. Tax revenues actually declined in real terms from 1989 to 1992, outlays increased, and the deficit widened again to almost 5 percent of GDP in 1992. Contributing to the gloomy picture was a large dose of bad luck. The savings and loan crisis led to an eruption of spending to make good on deposit insurance. Many states figured out a loophole in Medicaid reimbursements that enabled them to enrich state coffers for non-Medicaid purposes. These "disproportionate share" payments caused Medicaid to grow by close to 30 percent a year for a couple of years. CBO projections of the budget outlook grew more pessimistic at the start of 1992. The budget office announced that it expected a deficit of $350 billion for that year, which would have been 6 percent of GDP. The actual 1992 deficit was 5 percent of GDP; still not a reassuring number.
What brought the surplus?
When I came to CBO in March 1995, the budget office was projecting deficits of 3 percent of GDP "as far as the eye could see." This projection was based on what appeared to be reasonable assumptions at the time. Although the economy had recovered from the 1990-91 recession, it did not experience the usual spurt in growth that is typical of the early years of an expansion. Real GDP grew by about 3 percent a year during the 1992-94 period compared with the 5 percent growth rates in the comparable years following the 1982 and 1974-75 recessions. The Clinton tax hike enacted in 1993 increased revenues, but they had not risen above 18.1 percent of GDP.
Although we did not know it then, these pessimistic forecasts were probably one of the proximate causes of today’s unanticipated surplus. The large actual deficits, and projections of more of the same, put tremendous pressure on legislators to find ways to reduce federal spending. Deficit reduction appeared on the national stage when it became a central issue of the 1992 presidential campaign. But even before that, the high deficits of the 1980s had spurred legislative efforts to reduce the deficit. The Gramm-Rudman-Hollings (GRH) legislation of 1985 specified deficit targets and spending cuts to be made automatically if the targets were not met. The targets proved impossible to meet in years when underlying conditions worsened unexpectedly. In 1990, a new budget act replaced GRH with far more effective rules: ceilings or "caps" on discretionary outlays and the so-called "paygo" provision requiring any new legislation that would increase entitlement spending or reduce taxes to be paid for with a cut in other entitlement spending or a tax increase. (The 1990 legislation also contained the famous tax increase that caused President Bush to break his "no new taxes" pledge.) The caps and spending restrictions of the 1990 act were subsequently renewed in 1993 and again in 1997. When the newly elected Republican majority came to Congress in January 1995, the goal shifted from deficit reduction to the more ambitious one of balancing the budget by 2002.
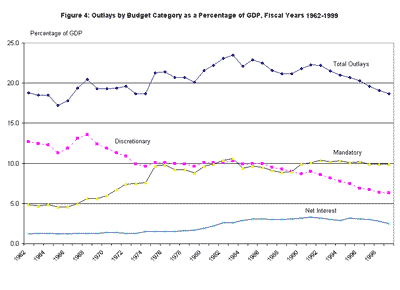
Did these budget rules work? Clearly growth in outlays slowed dramatically through the 1990s. From a level of 21.2 percent of GDP in 1989 — the low point of the 1980s — outlays fell to 18.7 percent of GDP in 1999, a level not seen since 1974. Some of that reduction is attributable to very low inflation, which reduced cost-of-living adjustments, and to lower interest rates, which reduced payments on the federal debt. The growth in spending on Medicare and Medicaid was lowered in part as a result of legislation and in part for reasons not wholly understood. However, most of the reduction in outlays came from a huge decline in discretionary spending, which fell to 6.3 percent of GDP in 1999 from 9 percent in 1989 (see Figure 4). Discretionary spending, in fact, did not even increase as much as inflation, declining in real terms by almost 9 percent over the decade.
It is tempting to credit the budget caps with the reduction in discretionary spending. However, all of that reduction came from cutbacks in defense, which in nominal dollars declined by 9 percent from 1989 to 1999 and in real terms by 29 percent. Should the credit for defense cutbacks be given to the peace dividend from ending the Cold War, or was it the budget caps? There is no counterfactual that would enable us to answer that question scientifically. In my view, having observed Congress struggling with a constant stream of requests and temptations to spend more, the caps provided an important reason to say no. Violating the caps in the face of large deficits was not something to be done lightly. Congress generally abided by the caps, exceeding them only slightly, and then in allowed areas where Congress could claim an emergency or a disaster. Two divergences from the general pattern are worth noting. One occurred in 1996, when actual discretionary spending was $13 billion below the legislative ceiling. That was the year of the battle of the budget between Congress and the president; the year of government shutdowns and snowstorms that kept the government closed and the year of many months without an enacted budget in place. The Republicans may have paid a political price, but the deficit was narrowed by a year of low spending. Moreover, the president was brought aboard the balanced budget movement. The president’s initial budget that year contained no deficit reduction proposals. But just a few months later, the administration countered the congressional plan calling for balance by the year 2002 with its own proposal for balancing the budget by 2005; and as the summer turned to winter, it came to accept the 2002 target date and put forth its own ideas for how to get there.
In contrast, the other divergence involves the opposite behavior in the face of current rosy budget forecasts. In 1999 and 2000, for the first time in many years, surpluses were anticipated well in advance of the annual round of legislative activity on the budget. And in both 1999 and, as it now appears, 2000, discretionary spending has grown faster than inflation, as the caps have been stretched by classifying more and more spending as "emergency" and by resorting to a variety of gimmicks that have shocked even the most cynical budgeteers.
The revenue side
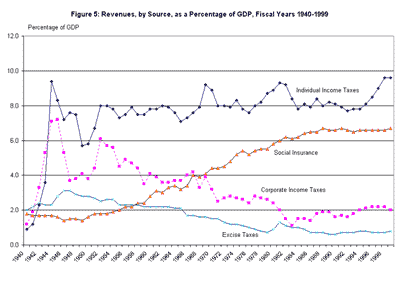
The biggest surprise in the advent of the surplus, however, has come from the revenue side of the ledger and in particular from the extraordinarily rapid growth in individual income tax receipts since 1994 (see Figure 5). From 1994 to 1999, income tax payments outpaced GDP growth, increasing from 7.8 percent to 9.6 percent of GDP, the highest level in the postwar period. No new tax legislation is responsible for that increase — the 1993 tax act raised tax rates for the richest taxpayers and that was largely reflected in 1994.
The CBO attributed the growth in individual income tax receipts in excess of GDP growth to four factors over the period 1994-98. The first is an increase in the share of GDP that is taxable personal income, and it accounts for almost 20 percent of the excess growth in individual income taxes. The second factor is the explosion in taxable capital gains, which grew even faster than taxable personal income. It accounts for 30 percent of the income tax surge. (Capital gains realizations close to tripled over this period, with most of the increase occurring before the cut in capital gains taxes in 1997.) The third factor, accounting for 10 percent of the income tax increase, comes from a rapid rise in assorted retirement income like 401(k) plan distributions.
The most important reason for the growth in income tax receipts, however, accounting for more than 40 percent of the increase, is a rise in the effective tax rate on adjusted gross income. The effective tax rate increased for two reasons. One was an increase in real incomes, which moved more taxpayers into the highest brackets — what might be called "real bracket creep." (The income tax was indexed for inflation, but not for increases in real income.) The other factor increasing the effective rate was the relatively rapid growth in income among those taxed at the highest rate. Estimates suggest that from 1994 to 1998, the share of total adjusted gross income (AGI) received by the 1.6 percent of taxpayers with incomes of $200,000 or more increased from 15 percent to 22 percent, and their share of tax liabilities increased from 30 percent to 40 percent.
The factors underlying the surge in revenues are not easily predicted. Rapid growth in the economy does not necessarily produce the kinds of changes in the income distribution or increases in capital gains that have occurred since 1994. CBO and other forecasters could not have anticipated these unusual changes. And once they occurred, there was no way to know how long they would last.
There are two additional factors that I believe contributed significantly to the evaporation of the budget deficit. One is the absence of legislation that meddled with the economy or that had major, long-run spending consequences for the budget. The ambitious Clinton health plan likely would have had such an impact on the budget, and in addition could have had a damaging effect on the economy. Gridlock seems to be good medicine for the economy.
The other factor is good luck. The surprises that occurred after 1992 turned out to be beneficial to the budget, on both the revenue and outlay sides. The stock market boosted revenues, the slowdown in medical cost increases and the switch to managed care slowed Medicaid costs, the Asian financial crisis helped lower our consumer prices by providing us with cheap imports. But such good luck cannot always be counted on.
Will the surplus last?
The sudden appearance of the surplus in 1998 brought to mind the old Cole Porter song: "Is it an earthquake, or only a shock? Is it the good turtle soup, or merely the mock?" Similarly, do we have huge surpluses as far as the eye can see? Or is it only a mirage? Obviously, a projection is just that. One way to assess the uncertainty surrounding a projection is to look at alternative projections based on alternative assumptions about the economy. The CBO report on the budget outlook provides two alternatives to the baseline projection, one based on more optimistic assumptions and the other based on pessimistic assumptions (see Table).
|
TABLE |
||||||
|
2000 |
2005 |
2010 |
Total 2001-2010 |
|||
|
Economic Scenario: Assumes Discretionary Spending Is Held To CBO's Estimates of the Caps Through 2002, then Grows With Inflation |
||||||
|
Optimistic |
208 |
700 |
1,317 |
7,864 |
||
|
Baseline |
176 |
376 |
633 |
4,234 |
||
|
Pessimistic |
141 |
(4) |
(142) |
22 |
||
|
Economic Scenario: Assumes Discretionary Spending Grows With the Rate of Inflation After 2000 |
||||||
|
Optimistic |
208 |
591 |
1,173 |
6,784 |
||
|
Baseline |
176 |
268 |
489 |
3,152 |
||
|
Pessimistic |
141 |
(113) |
(286) |
(1,058) |
||
|
NOTE: The main economic assumptions that are varied in the three scenario are -- real GDP growth; the share of wages and profits in GDP; personal income taxes as a percentage of taxable personal income in the national income and product accounts; and the growth rate of Medicare and Medicaid spending. The average annual GDP growth rate over the period 2000--2010 is 3.2 percent under the optimistic scenario. 2.8 percent under the CBO baseline and 2.1 percent under the pessimistic scenario. See Tables 5.2 and 5.3 of the Budget and Economic Outlook: Fiscal Years 2001--2010, Congressional Budget Office. |
||||||
The differences in assumptions between the optimistic and pessimistic scenarios reflect the dilemma of today’s forecaster, who must decide whether the future will resemble the past — meaning the past couple of decades — or whether the remarkable economic developments of the past few years point to a more favorable outlook. The CBO baseline takes a middle road, but one leaning more toward the optimistic than the pessimistic path. For example, under the optimistic scenario, the real GDP growth rate averages 3.2 percent a year over 2000 to 2010; under the pessimistic scenario it averages 2.1 percent, and for the baseline it is 2.8 percent.
Underlying the differences in GDP growth rates are differences in labor productivity growth, which is projected to grow at a 2.6 percent average annual rate under the optimistic scenario — the actual growth rate of the past three years — and 1.6 percent under the pessimistic scenario — the growth rate of the past couple of decades. The baseline assumes that labor productivity will increase at a rate of 2.3 percent.
Other key assumptions relate to the share of GDP going to income sources taxed at high rates, to personal income tax liabilities as a percentage of taxable income, and the expected growth in Medicare and Medicaid spending. With respect to the two factors that helped produce the surge in revenues over the past few years — increases in capital gains and increases in effective tax rates — the optimistic scenario assumes a continuation of this pattern for several more years, while the pessimistic scenario assumes a gradual reversal of the pattern.
The cbo projections are based on current policy and therefore assume no changes in laws governing taxes or mandatory spending. However, discretionary spending has no clear policy. So CBO assumes different possibilities. Two of these possibilities are shown in the table. The more stringent assumes that the current schedule of caps on discretionary spending are adhered to through the final legislated year, which is 2002, after which discretionary spending grows with inflation. The alternative assumption ignores the caps and has discretionary spending growing with inflation after 2000. Given the current fragility of the caps, the higher spending path is more plausible and could turn out to be an underestimate of discretionary outlays.
The pessimistic economic assumptions are remarkably close to the baseline assumptions of just a few years ago. The optimistic ones reflect the current state of affairs. The outcomes are very different. Under the optimistic scenario, the accumulated total budget surplus over the next decade (2001-2010) reaches $7 trillion to $8 trillion, depending on what one assumes about discretionary spending. But under the pessimistic scenario the surplus turns into a deficit midway, accumulating $1 trillion in deficits over the decade if one accepts the higher spending path for discretionary outlays. (If, under the pessimistic scenario, discretionary spending is held to the current caps, the lapse into deficits is delayed.)
Recently, it has become popular to view as the true surplus the "on budget" surplus, which excludes the surplus in the Social Security accounts (today’s sacred cow). If the pessimistic scenario comes true and discretionary spending grows with inflation, the on budget surplus would vanish and deficits of $3 trillion would accumulate over the decade.
In the near term it is likely that the booming economy will continue to boost revenues, producing a sizable surplus (see Figure 6). How big and for how long are the questions. There are some obvious unknowns with respect to the economy. Is inflation reappearing? Can the Federal Reserve, even with Alan Greenspan at the helm, bring off the proverbial "soft landing"? The more immediate problem, however, is the spending side of the budget. The combination of a potentially large surplus and the coming election may prove too tempting to resist this year, and belts may well be further loosened to allow for a great deal more spending than we have seen for the past few years.
Budget and tax policy
However uncertain the size and time pattern of the surpluses may be, they are surely having a big influence on the political process. Amidst the surplus hoopla there are some aspects of the current discussion that strike me as muddled or misleading.
Proposals to "Save Social Security" have become the most politically popular use of the surplus. However, Social Security is a pay-as-you-go system in which the benefits of current retirees are paid by the taxes of current workers. The financial problem that these proposals presumably address is the shortfall in payroll taxes that is expected to occur when the baby boomers retire and the number of beneficiaries per worker will be much greater than it is today.
But the "Save Social Security" proposals are deceptive in this regard. They do not propose any reforms that would directly correct these future imbalances. In fact they have little direct connection with Social Security at all. They imply that the government has the ability to store up current surpluses in a fund that can be drawn down in the future to cover gaps between payroll taxes and benefit obligations. But there is no existing mechanism to do this. The Social Security Trust Fund is not a trust fund in the usual sense, but instead simply holds the IOUs of the Department of the Treasury. Once payroll tax revenues fall short of benefit obligations — and that is expected to occur around 2015 — the government will have to make up the difference by borrowing from the public (unless taxes are raised or spending reduced in other programs).
One sometimes hears that the current Social Security surplus could be invested in private assets to ease the future problem. But putting the government in the business of investing taxpayer dollars in private stocks and bonds is simply not a viable option given the size of the funds involved and the potential for serious government intrusion in private business.
What the "Save Social Security" proposals actually do is guarantee that the Social Security surplus is used to retire the publicly held national debt. The Social Security surplus, which is the difference between Social Security taxes and benefits, is expected to account for about 85 percent of the total surplus this year. Therefore, by placing it off limits for spending or reducing taxes, the pressure for fiscal prudence will be greatly increased. That is not a bad thing if it deters wasteful spending. However, it will be a bad thing if it obscures the long-term problems in the Social Security system and deters efforts to develop structural reform.
One controversial economic issue is whether there are significant benefits to be gained from retiring the debt and whether those benefits are worth the sacrifice of other potential uses of the surplus. One argument given for running large surpluses to retire the debt is that in the process it would add to national savings, which in turn would increase growth and the nation’s standard of living in the future. This effect, however, depends on linkages between debt retirement, savings, and productivity growth that are not well understood. Clearly debt reduction will tend to lower interest rates and make it somewhat easier for business to borrow for investment. But lower interest rates are probably not an important determinant of the rate of innovation that spurs productivity growth. Indeed, economists have been unable to explain the causes of the productivity boom in the 1950s and ’60s, the slowdown in the 1970s and ’80s, or the apparent return of high productivity in the past few years — a period of declining saving.
A second argument for retiring the debt is that even if it had no effect on growth, it certainly would reduce or eliminate the portion of the budget that today is used to pay interest on the debt. Interest payments on the national debt currently consume 2.5 percent of GDP. With no interest payments in the federal budget, the taxes of future generations of workers will be lower than they would otherwise be. It will therefore be easier for these future generations to pay the added taxes needed for the Social Security benefits of retired baby boomers. But there is no way to guarantee that the no-interest dividend would be used for that purpose.
This argument also raises issues of intergenerational equity. Although we are often told of our obligation to future generations, those future generations probably will be richer than we are. Moreover, they will be benefiting from many of the activities or programs that the debt helped to finance (for example, medical research and the defense buildup during the 1980s that helped to end the Cold War). Shouldn’t future generations be willing to pay for some of these benefits?
Another possible and important use of the surplus would be to make structural reforms in Social Security through conversion to a partially privatized system of individual accounts. That could be achieved by reducing the payroll tax and diverting the proceeds to individual accounts.
In my view, Medicare is in even more serious need of structural reform than Social Security. Yet the bulk of the discussion of Medicare centers on using surplus funds to shore up or even fatten the program with new benefits such as prescription drugs. The Breaux Commission pointed the way to genuine reform, though not much has been heard about it of late. (The Breaux Commission’s proposal would move Medicare from a defined benefit program towards a defined contribution program.)
Fast to feast
Of course, there are myriad ways to lay claim to the surplus, and after a decade of relative fasting, many are ready for the feast. However, what I find quite amazing is the apparent willingness of a large segment of the public to accept further restraint in the form of paying down the debt as an end in itself. This is certainly prudent if the only viable political alternative is a grab bag of spending programs that would be inefficient uses of the GDP.
However, there are worthy alternative policies to debt reduction. As I see it, the major contender is a general cut in marginal tax rates combined with tax reform that would correct some of the distortions that have emerged since the 1986 tax reform legislation. One reason for a tax cut is that without it, effective tax rates will continue to rise as real income increases, boosted by productivity gains. The individual income tax was indexed for inflation, but not for real wage growth. In a progressive tax system, indexing for real income growth is needed just to maintain a constant share of taxes to GDP. A second reason for favoring a tax cut is that popular proposals for spending — such as more federal funds for education — are in areas that are appropriately financed at the state and local level. A federal tax cut leaves room for smaller government units to raise taxes, if lack of tax money is believed to be the real problem. A third reason for tax cuts is that they may be more effective for stimulating growth than debt retirement would be.
But in the short run — certainly for this budget season — I see little downside to waiting and allowing the surplus to reduce the debt further. It would give us more time to gauge whether we have really reached a new "plateau of prosperity" — in the immortally mistaken words of Irving Fisher in 1929.


