- Economics
What's Behind the Numbers? allows authors to provide additional insight and an explanation into how they arrive at their conclusions. It consists of the data files, calculations, and other materials that inform the analysis but do not traditionally fit into an op-ed.
This is the statistical backup for the statements Edward P. Lazear made in the January 28, 2016 The Wall Street Journal op-ed “If Only Hillary and Bernie Would Recall JFK”. Data are from the Bureau of Labor Statistics’ (BLS) Current Population Survey (CPS) from 1980-2014
The earnings definition used is the standard BLS earnings variable defined as the total value of individual earnings from wages and salaries and self-employment.
Table 1: Summary Statistics
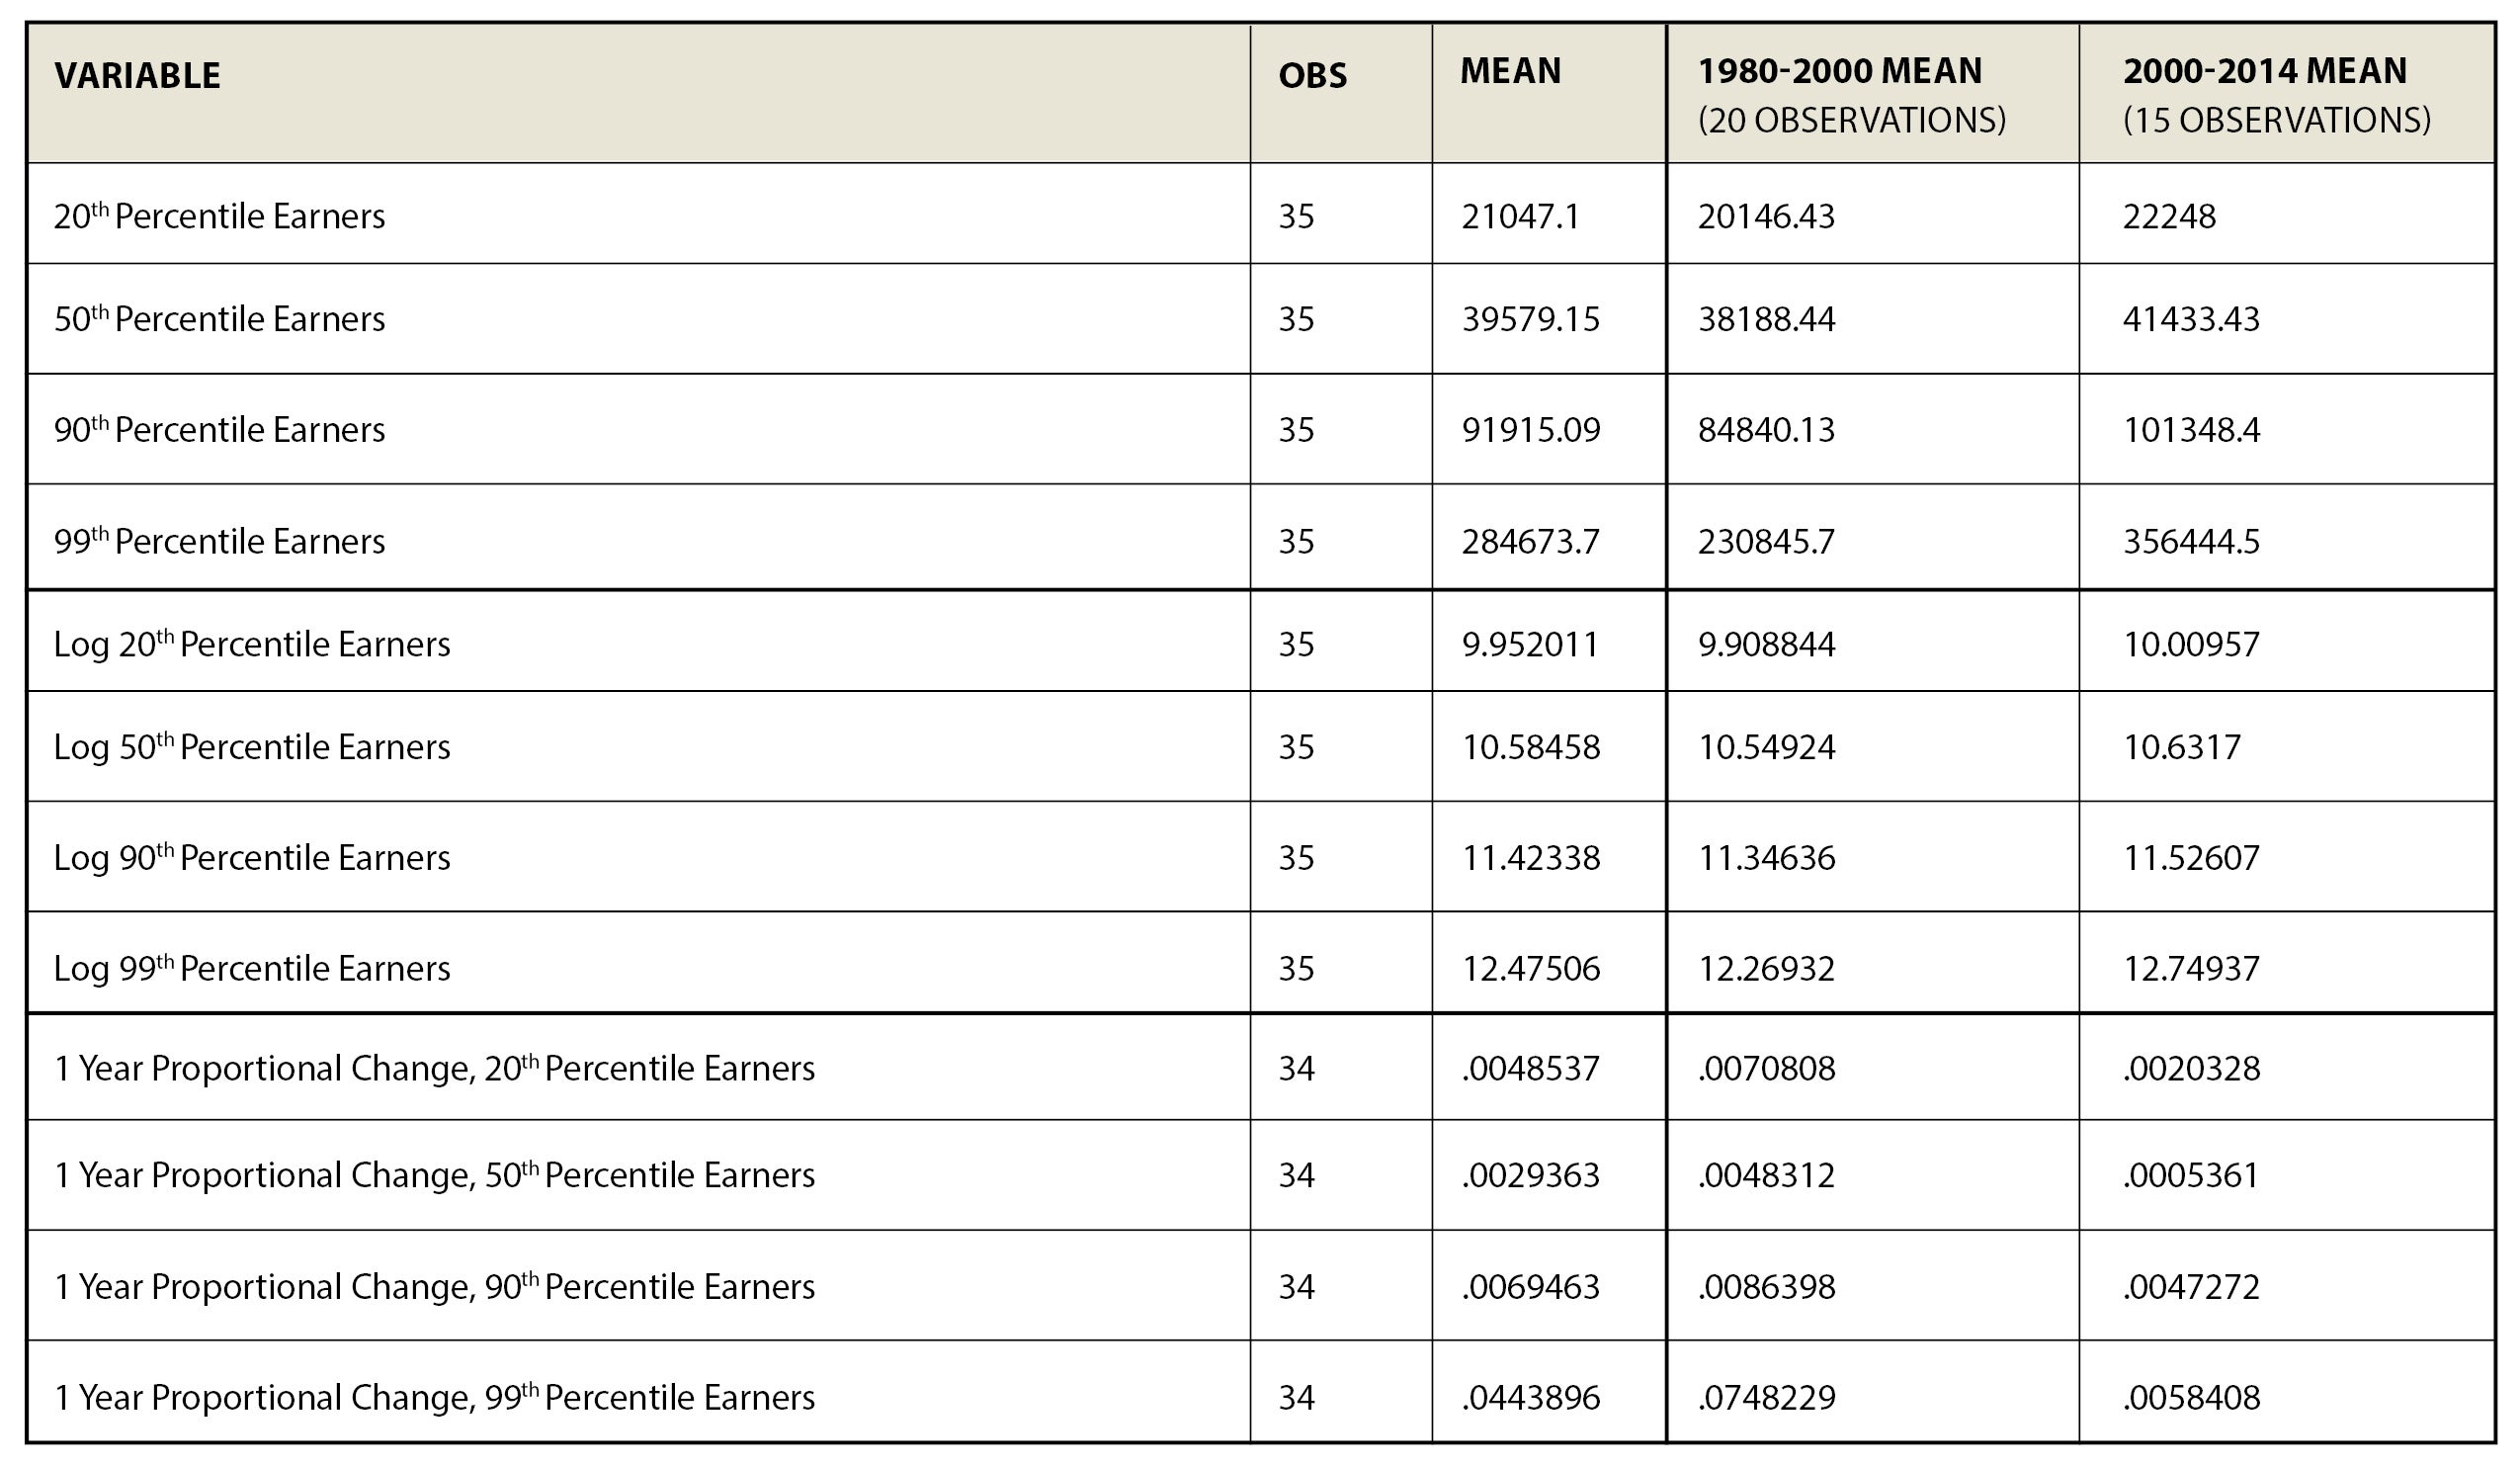
Data from 1980 – 2014 Source: U.S. Census Bureau, Current Population Survey 1980-2014
From 1980-2000, the earnings of the 90th percentile earner (the person whose earnings are higher than the bottom 90% of earners and lower than the top 10% of earners) grew three times as fast as it did from 2000 on. The same was true of the earnings of the 20th percentile earner, which also grew three times as fast between 1980 and 2000 as it did between 2000 and 2014. Lastly, and noteworthy, is that the earlier period was also one in which GDP grew about twice as rapidly as it did during the latter period.
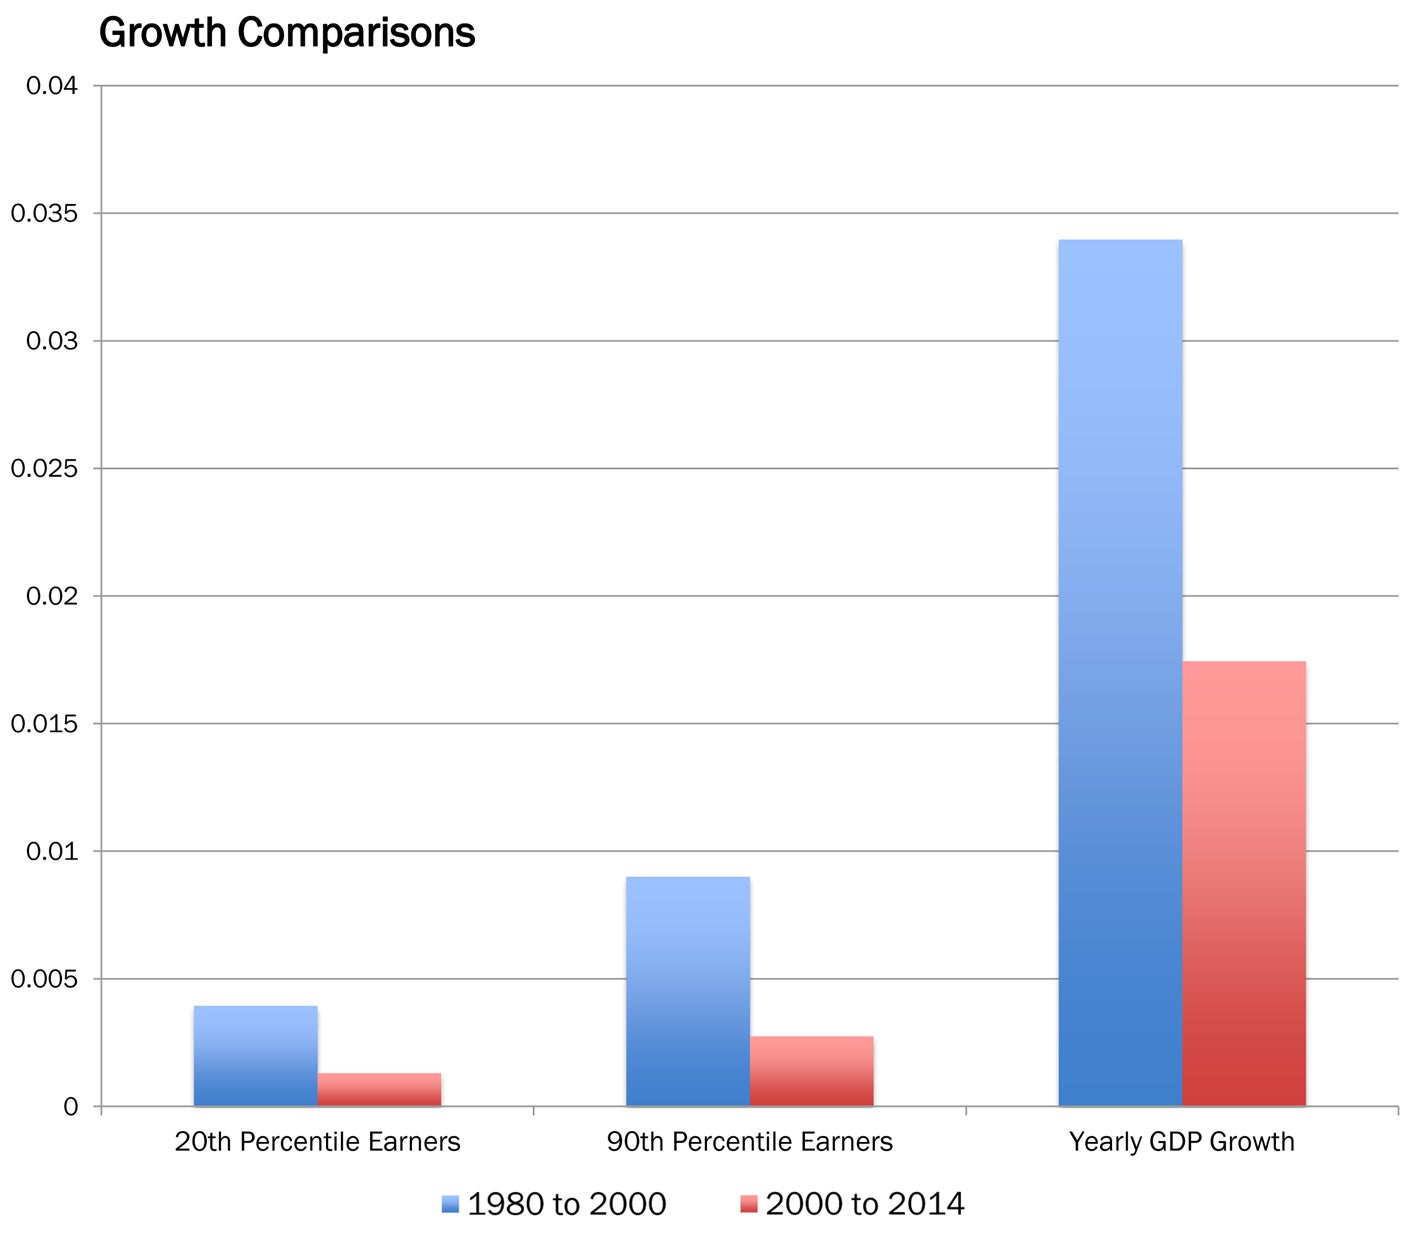
Figure 1: Evidence that earnings of the 90th percentile and 20th percentile grew faster during periods of high GDP growth. Source: CPS Data 1980-2014
This linkage appears in bad times as well. The 90th percentile, the 20th percentile and the median earner (defined as the earner at the 50th percentile) saw actual declines in real earnings from 2008 to 2014.
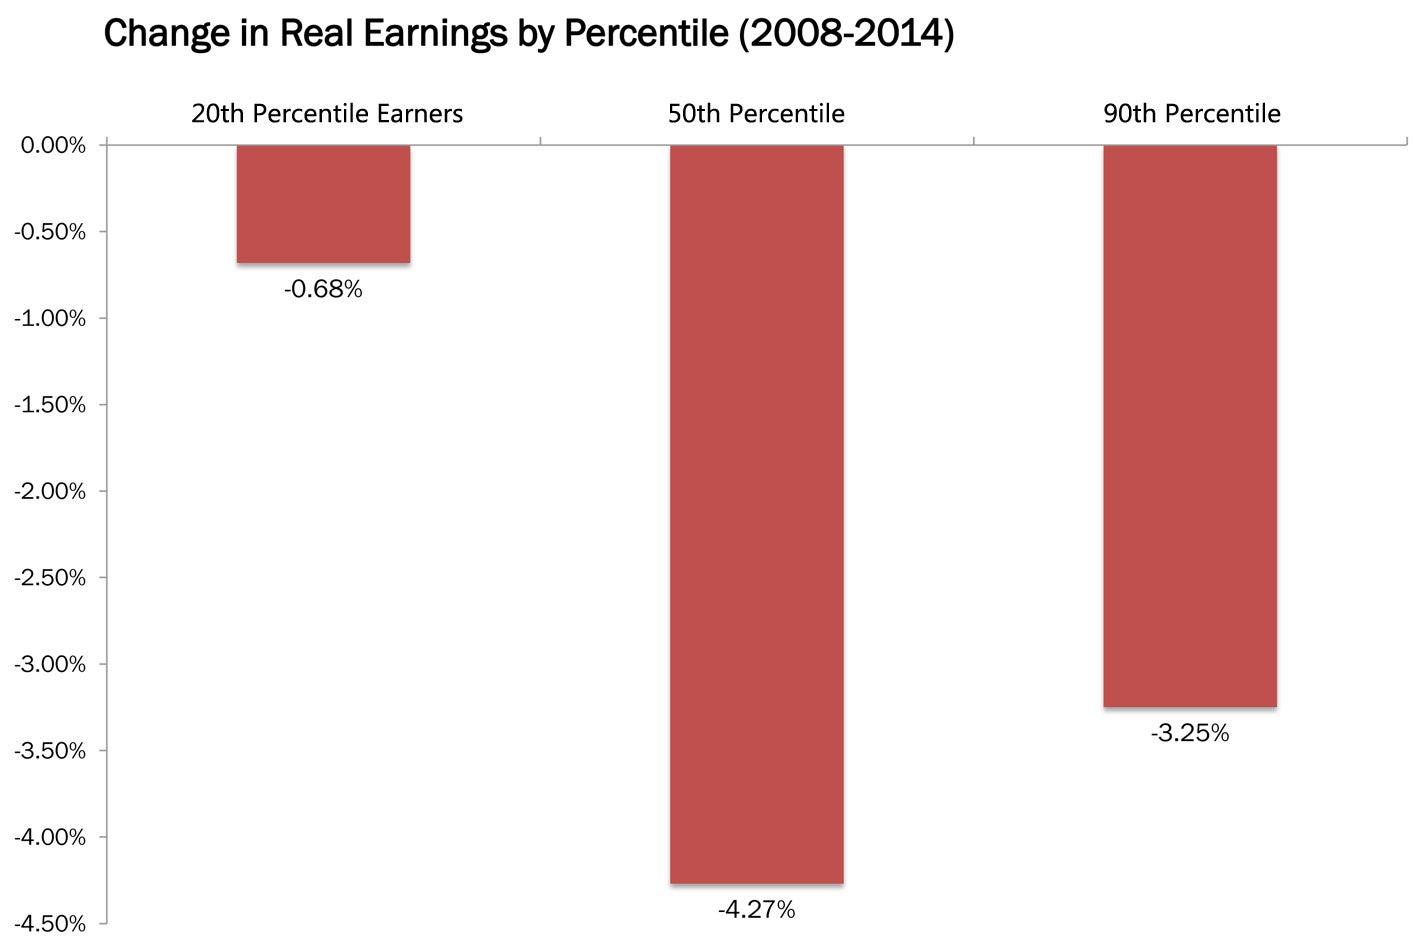
Figure 2: Evidence that the 90th percentile, the 20th percentile and the median earner (defined as the earner at the 50th percentile) saw actual declines in real earnings from 2008 to 2014. Source: CPS Data 1980-2014
The various income groups move together, and there is a statistically strong correlation between the growth in earnings of the 90th percentile earner, of the median earner and of the earner who is at the 20th percentile.
Table 2: Time Series Regressions of Proportionate Growth in Earnings, Various Percentiles of Earnings
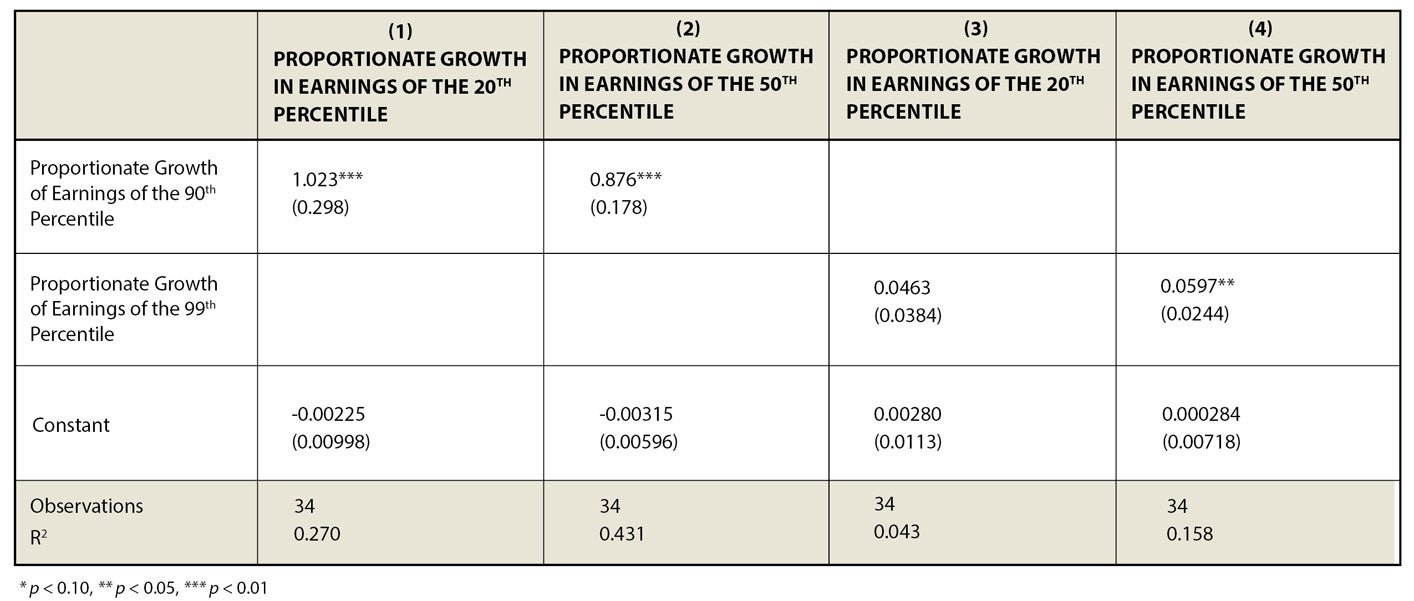
Table 3: Time Series Regression of 20th Percentile Earnings on 90th Percentile Earnings
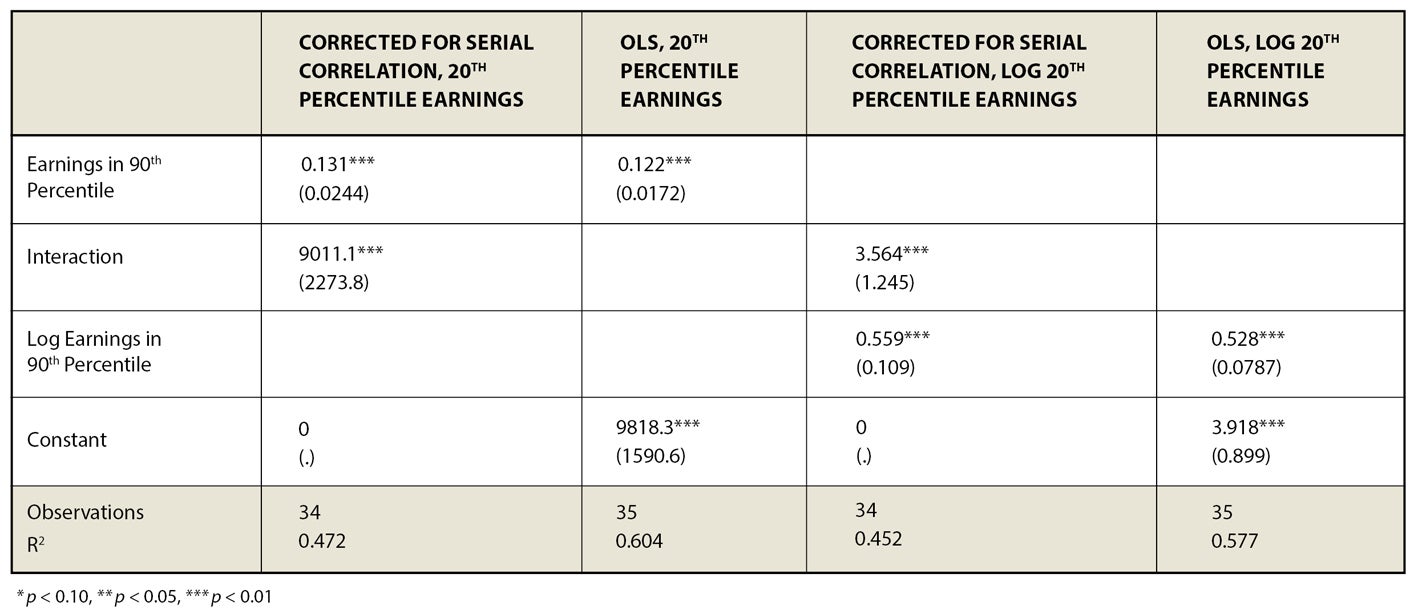
Table 4: Time Series Regression of 50th Percentile Earnings on 90th Percentile Earnings
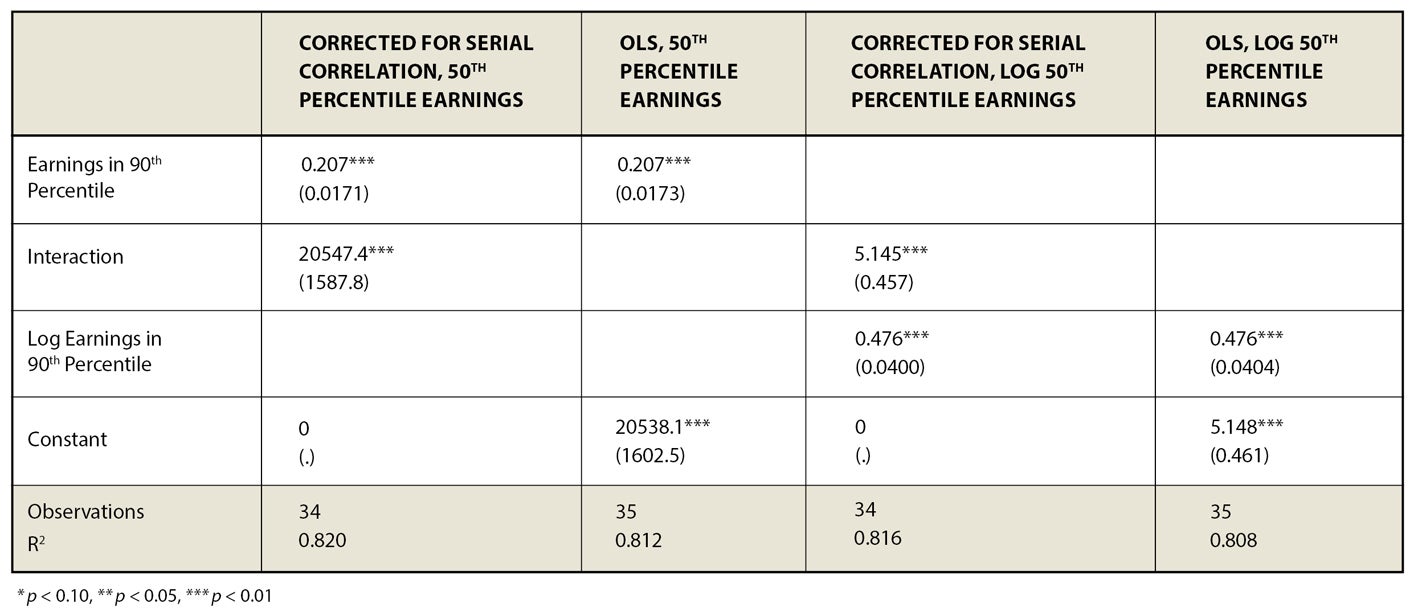
Table 5: Time Series Regression of 20th Percentile Earnings on 99th Percentile Earnings
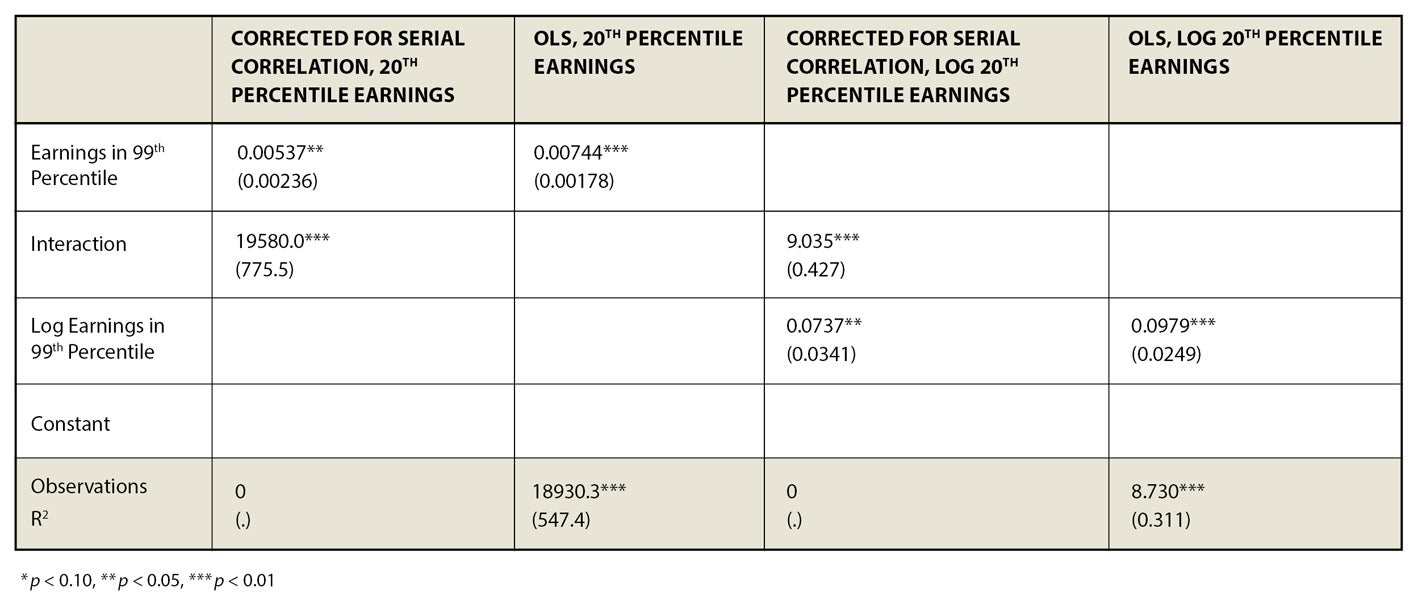
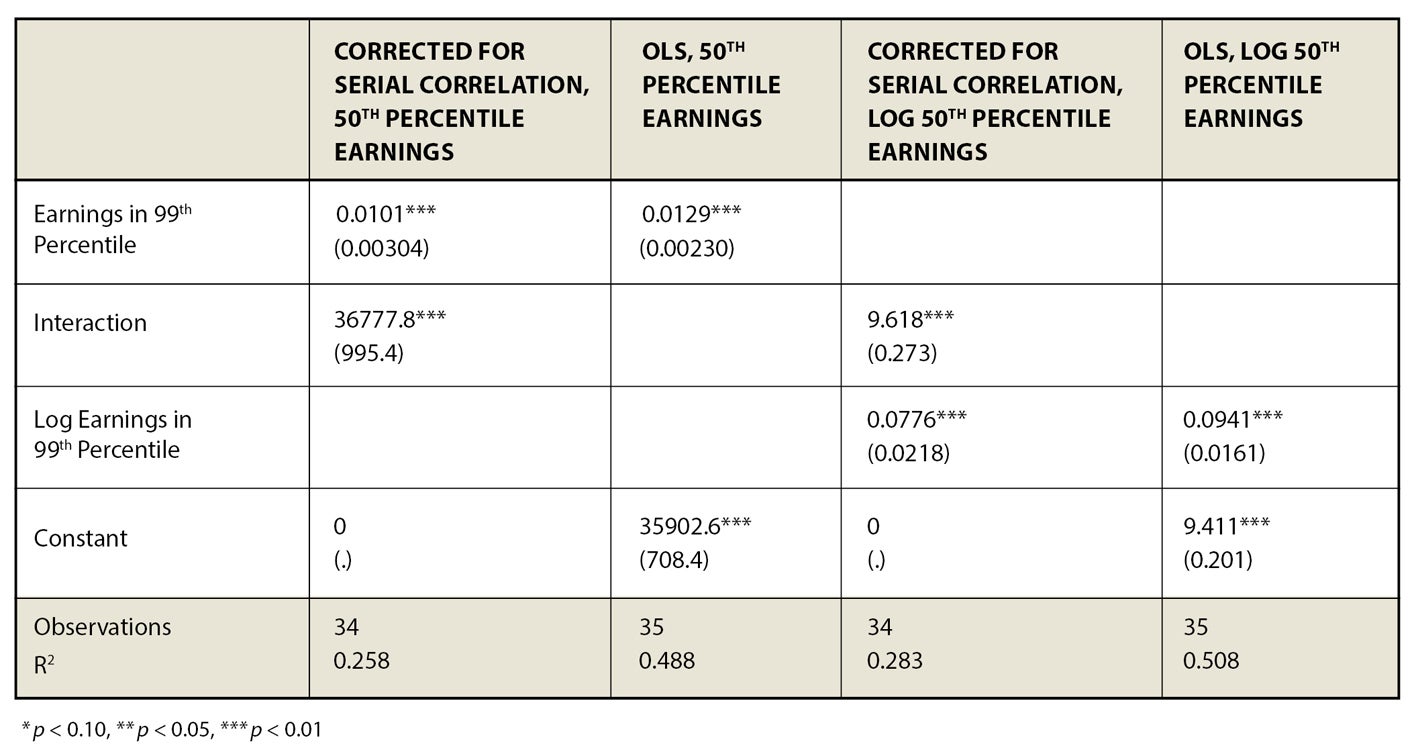
Table 6: Time Series Regression of 50th Percentile Earnings on 99th Percentile Earnings